Practice questions available in McGraw Hill Math Grade 6 Answer Key PDF Unit Test Lessons 24-25 will engage students and is a great way of informal assessment.
McGraw-Hill Math Grade 6 Unit Test Lessons 24-25 Answer Key
Question 1.
Look at the chart of Walter’s Dog House sales of hot dogs.
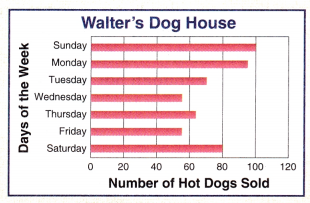
On what day were the most hot dogs sold? _______________
The fewest? _______________
About how many more hot dogs were sold on Sunday than Saturday? _______________
Answer:
The most hot dogs sold on Sunday.
The fewest hot dogs sold on Wednesday and Friday.
The number of hot dogs sold on Saturday are 80.
The number of hot dogs sold on Sunday are 100.
100 – 80 = 20
20 more hot dogs are sold on Sunday than Saturday.
Question 2.
Look at the line graph of school dance ticket sales.
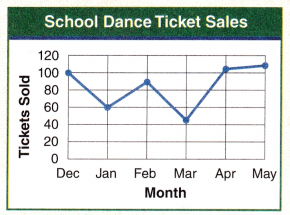
In what month were the most tickets sold? _______________
About how many tickets were sold that month? _______________
In what month were the fewest tickets sold? _______________
Answer:
Most of the tickets are sold in May month.
In may month 110 tickets are sold.
In March month fewest tickets are sold.
Question 3.
Look at the double-line graph of teenage employment rates.
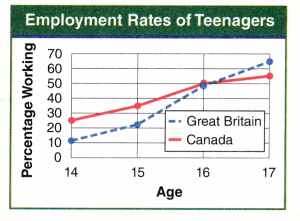
At which age are a higher percentage of British teenagers employed than Canadian teenagers? _______________
Based on this line graph, would you say it is easier for a fourteen-year-old to find a job in Canada or Great Britain? _______________
Answer:
A higher percentage of British teenagers employed than Canadian teenagers at age 17.
Based on the above line graph, we can say it is easier for a fourteen-year-old to find a job in Canada.
Question 4.
Look at the circle graph of favorite breakfast foods.
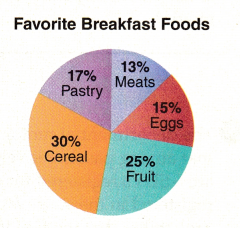
What is the favorite breakfast food as voted on by students? _______________
Do more students prefer cereal than meat and eggs combined? _______________
If so, by what percentage? _______________
Answer:
The students voted the favorite breakfast food as Cereal.
Yes, more students prefer cereal than meat and eggs combined.
30% of students prefer Cereal.
28% of students prefer meat and egg combined.
13% + 15% = 28%
30% – 28% = 2%
2% of students prefer Cereal than meat and egg combined.
Question 5.
Bird Watchers of America was conducting its annual census for birds of prey. They recorded the following number of daily sightings for a ten-day period in October: 6, 8,10,10,14, 9, 8,10, 6, 5
What is the average number (mean) of sightings per day? _______________
What is the median of the sample of daily sightings? _______________
What is the mode of the sample of daily sightings? _______________
Answer:
The given set of data is 6, 8,10,10,14, 9, 8,10, 6, 5.
Mean = Sum of all the numbers/Total number of numbers.
Sum of given set of data is as below,
6 + 8 + 10 + 10 + 14 + 9 + 8 + 10 + 6 + 5 = 86
The total number of numbers in the given set of data is 10.
Mean = 86/10
Mean = 8.6
The average number of sightings per day is 8.6.
The given set of data is 6, 8,10,10,14, 9, 8,10, 6, 5.
The median of a given set of data is the middle number in the set.
To calculate the median first we have to arrange the data either in ascending order or descending order.
The given set of data in ascending order is 5, 6, 6, 8, 8, 9, 10,10, 10, 14.
If the number of addends are even then the median is equal to average of the two middle ones.
(8 + 9)/2 = 17/2 = 8.5
The median of the sample of daily sightings is 8.5.
The number that occurs the most in the given set of numbers is called a mode.
We can have more than one mode or no mode at all.
In the given series 6, 8,10,10,14, 9, 8,10, 6, 5.
The number 6 are 2.
The number 8 are 2.
The number 10 are 3.
The number 14 is 1.
The number 9 is 1.
The number 5 is 1.
The mode of the sample of daily sightings is 10.
Question 6.
Freda has been appointed the official scorekeeper for the school bowling team. She recorded the following scores for her teammates over the past two weeks:
Marissa: 55, 59, 63, 71, 45
Jeremy: 65, 64, 46, 56, 49
Freda: 71, 78, 81, 65, 72
Charmaine: 56, 59, 60, 65, 76
Create a stem-and-leaf plot using the data.
Answer:
Explanation:
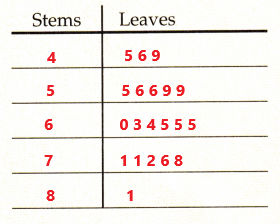
The recorded scores of bowling team over the past two weeks are arranged from least to greatest as 45, 46, 49, 55, 56, 56, 59, 59, 60, 63, 64, 65, 65, 65, 71, 71, 72, 76, 78, 81.
In this stem and leaf plot, the stems are the scores in tens and the leaves are the ones of the scores. The stem and leaf plot are arranged using the above data.
Question 7.
Using the raw data for the bowling scores in Exercise 6, create a box-and-whisker plot of the data.
What is the range of the data? _______________
What is the median of the data? _______________
Answer:
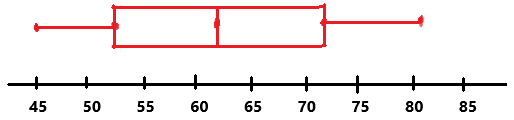
The above box-and-whisker plot allows us to look at data to tell where most of the numbers lie.
The raw data for the bowling score is 45, 46, 49, 55, 56, 56, 59, 59, 60, 63, 64, 65, 65, 65, 71, 71, 72, 76, 78, 81.
The lower extreme is the lowest number in the given data which is 45.
The higher extreme is the highest number in the given data which is 81.
The range of the data is equal to the difference between the higher extreme and lower extreme.
81 – 45 = 36
The range of the data is 36.
The median of a given set of data is the middle number in the set.
If the number of addends are even then the median is equal to average of the two middle ones.
(63 + 64)/2 = 63.5
The median of the data is 63.5.
The lower quartile is the median of the numbers below the median.
(49 + 55)/2 = 52
The upper quartile is the median of the numbers above the median.
(71+ 72) = 71.5
Question 8.
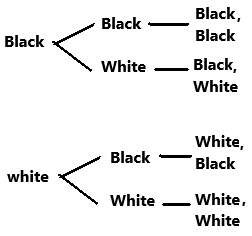
Eddie gathered stones from a nearby stream. He collected 12 stones in all and he noticed that 8 were black and 4 were white before he put them in a bag. Draw a tree diagram to show the possible outcomes if Eddie were to pick a stone from the bag, record the color, and return the stone to the bag and pick again.
What is the probability that Eddie will pick a black stone on the first pick? _______________
What is the probability that Eddie will pick a white stone on the first pick? _______________
Answer:
Total number of stones = 12
Total number of black stones = 8
Total number of white stones = 4
Probability of picking a black stone from the bag = 8/12 = 2/3
Probability of picking a white stone from the bag = 4/12 = 1/3
Question 9.
Priscilla recorded the arrival of the members of her book club. She noted that there were 25 members in attendance. 16 brought dessert and 15 brought beverages. Draw a Venn Diagram and record the data.
How many in the book group brought dessert and beverages? _______________
What percentage brought beverages only? _______________
Answer:
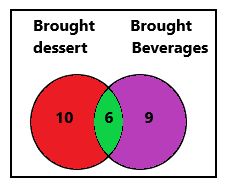
Out of 25 members 16 brought dessert.
So, members who brought only beverages = 25 – 16 = 9
Out of 25 members 15 brought beverages.
So, members who brought only desserts = 25 – 15 = 10
Members who brought both dessert and beverages = 25 – (9 + 10) = 6
So, 6 people brought both dessert and beverages.
Percentage of members who brought beverages only = (9/25) x 100 = 36%
Question 10.
Wallace and 15 other students each put their names on a piece of paper and put them in a cap.
If there are 9 girls in the group, what is the probability that a girl’s name will be picked from the cap? _______________
What is the probability that Wallace’s name will not be chosen? _______________
Answer:
Total number of students are 16.
1 + 15 = 16
There are 9 girls in the group.
Probability = The number of favorable outcomes/ The total number of possible outcomes
P = 9/16
The probability that a girl’s name will be picked from the cap is 9/16.
Except Wallace 15 other students each put their names on a piece of paper and put them in a cap.
The probability that Wallace’s name will not be chosen is 15/16.
Question 11.
Sue randomly throws darts at a wall covered with 100 balloons, 40 of which are red, 25 blue, 20 green, 10 yellow, and 5 orange.
What is the probability that Sue will pop a red or green balloon? _______________
What is the probability that Sue will pop an orange balloon? _______________
What is the probability that Sue will not pop a blue balloon? _______________
Answer:
Total number of balloons are 100.
Red color balloons are 40.
Blue color balloons are 25.
Green color balloons are 20.
Yellow color balloons are 10.
Orange color balloons are 5.
Probability of red or green balloons = The number of favorable outcomes/ The total number of possible outcomes
P = (40 + 20)/100
P = 60/100
The probability that Sue will pop a red or green balloon is 60/100 or 3/5.
Probability of orange balloons = The number of favorable outcomes/ The total number of possible outcomes
P = 5/100
The probability that Sue will pop an orange balloon is 5/100 or 1/20.
Probability of not blue balloons = The number of favorable outcomes/ The total number of possible outcomes
Except blue balloons add all balloons.
40 + 20 + 10 + 5 = 75
P = 75/100
The probability that Sue will not pop a blue balloon is 75/100 or 3/4.