Refer to our Texas Go Math Grade 8 Answer Key Pdf to score good marks in the exams. Test yourself by practicing the problems from Texas Go Math Grade 8 Lesson 15.1 Answer Key Mean Absolute Deviation.
Texas Go Math Grade 8 Lesson 15.1 Answer Key Mean Absolute Deviation
Texas Go Math Grade 8 Lesson 15.1 Explore Activity Answer Key
Understanding Mean Absolute Deviation
A measure of center is a single number used to describe a data set. One measure of center is the mean, which is the sum of the data values divided by the number of values in the data set. A measure of variability is a single number used to describe the spread of a data set. One measure of variability is the mean absolute deviation (MAD), which is the mean distance between each data value and the mean of the data set.
The data represent the height, in feet, of various buildings. Find the mean absolute deviation for each data set.
A. 60, 58, 54, 56, 63, 65, 62, 59, 56, 58
Calculate the mean. Round to the nearest whole number.
Complete the table.
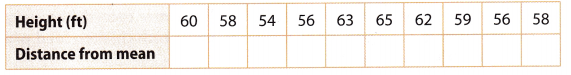
Calculate the MAD by finding the mean of the values in the second row of the table. Round to the nearest whole number.
Answer:
Given that the heights of the various buildings are 60, 58, 54, 56, 63, 65, 62, 59, 56, 58.
Mean = sun of the heights of the various buildings/ number of the heights of the various buildings. = 60 + 58 + 54 + 56 + 63 + 65 + 62 + 59 + 56 + 58/10 = 526/10 = 52.6
52.6 rounded to the nearest whole number is 53. Because the decimal point is greater than 5 then remove the fraction part and 1 to the decimal.
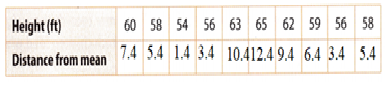
Given that the heights of the various buildings are 60, 58, 54, 56, 63, 65, 62, 59, 56, 58.
Mean = 52.6
Distance from mean equal to
60 – 52.6 = 7.4
58 – 52.6 = 5.4
54 – 52.6 = 1.4
56 – 52.6 = 3.4
63 – 52.6 = 10.4
65 – 52.6 = 12.4
62 – 52.6 = 9.4
59 – 52.6 = 6.4
56 – 52.6 = 3.4
58 – 52.6 = 5.4
Mean absolute deviation = sum of the distances from mean/number of the distances = 7.4 + 5.4 + 1.4 + 3.4 + 10.4 + 12.4 + 9.4 + 6.4 + 3.4 + 5.4/ 10 = 6.5
6.5 rounded to the nearest whole number is 7.
B. 46, 47, 56, 48, 46, 52, 57, 52, 45
Find the mean. Round to the nearest whole number.
Complete the table.
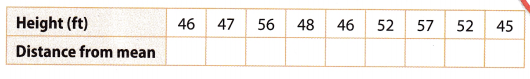
Calculate the MAD. Round to the nearest whole number.
Answer:
Given that the heights are 46, 47, 56, 48, 46, 52, 57, 52, 45.
Mean = sum of the heights by number of the heights = 46 + 47 + 56 + 48 + 56 + 52 + 57 + 52 + 45/9 = 459/9 = 51.
51 rounded to the nearest whole number is 51.
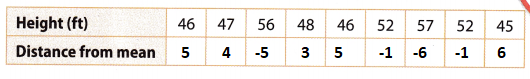
Given that the heights are 46, 47, 56, 48, 46, 52, 57, 52, 45.
Mean = 51
Distance from mean equal to
51 – 46 = 5
51 – 47 = 4
51 – 56 = -5
51 – 48 = 3
51 – 46 = 5
51 – 52 = -1
51 – 57 = -6
51 – 52 = -1
51 – 45 = 6
Neglect the negative signs.
Mean absolute deviation = sum of the distances/ number of the distances.
= 5 + 4 + 5 + 3 + 5 + 1 + 6 + 1 + 6/9 =30/9 = 3.3
3.3 rounded to the nearest whole number is 3.
Reflect
Question 1.
Analyze Relationships Compare the MADs. How do the MADs describe the distribution of the heights in each group?
Answer:
Mean absolute deviation of first heights is 6.5
Mean absolute deviation of seconds heights is 3.3
The mean absolute deviation of first heights is greater than the mean absolute deviation of seconds heights.
Using the formula distance = each height – mean. We can distribute the heights in each group.
Your Turn
Question 2.
Two baristas at a coffee shop each served 10 large coffees. The amount in each large coffee is shown below. Which barista’s coffees showed less variability?
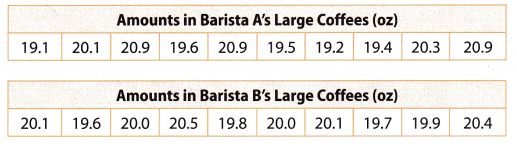
Answer:
Given that,
The Amount in the first Barista A’s large coffees = 19.1 + 20.1 + 20.9 + 19.6 + 20.9 + 19.5 + 19.2 + 19.4 + 20.3 + 20.9 = 199.9.
The Amount in the second Barista A’s large coffees = 20.1 + 19.6 + 20.0 + 20.5 + 19.8 + 20.0 + 20.1 + 19.7 + 19.9 + 20.4 = 200.1
The first coffee shop has the least variability.
Question 3.
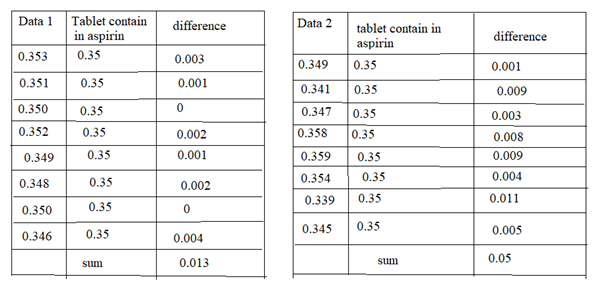
Two aspirin-making devices are set to make tablets containing 0.35 gram of aspirin. The actual amounts in 8 tablets from each device are shown. Use a spreadsheet to determine which device has less variability.
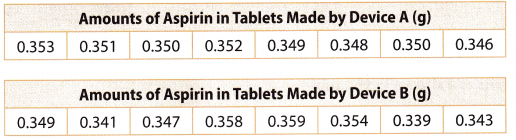
Answer:
Given that,
The tablets contained 0.35 grams of aspirin.
The amounts of Aspirin in tablets made by device A has the least variability.
Texas Go Math Grade 8 Lesson 15.1 Guided Practice Answer Key
Question 1.
A bus route takes about 45 minutes. The company’s goal is a MAD of less than 0.5 minute. One driver’s times for 9 runs of the route are shown. Did the bus driver meet the goal? (Explore Activity and Example 1)
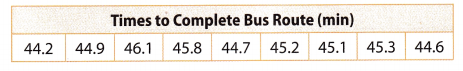
a. Calculate the mean of the bus times. ______________
Answer:
Given that the time to complete the bus route is 44.2, 44.9. 46.1, 45.8, 44.7, 45.2, 45.1, 45.3, 44.6.
Mean = sum of the bus time to complete the round/number of the bus rounds to complete the round.
44.2 + 44.9 + 46.1 + 45.8 +44.7 + 45.2 + 45.1 + 45.3 + 44.6/9 = 405.9/9 = 45.1
b. Calculate the MAD to the nearest tenth. ____________
The bus driver did /did not meet the company’s goal.
Answer:
Given that the time to complete the bus route is 44.2, 44.9. 46.1, 45.8, 44.7, 45.2, 45.1, 45.3, 44.6.
Mean = 45.1
Mean absolute deviation equal to first subtracting the mean from each route.
44.2 – 45.1 = -0.9
44.9 – 45.1 = -0.2
46.1 – 45.1 = 1
45.8 – 45.1 = 0.7
44.7 – 45.1 = -0.4
45.2 – 45.1 = 0.1
45.1 – 45.1 = 0
45.3 – 45.1 = 0.2
44.6 – 45.1 = -0.5
Neglect the negative sign.
Mean absolute deviation = sum of the mean from each value/number of the mean from each value = 0.9 + 0.2 + 1 + 0.7 + 0.4 + 0.1 + 0 + 0.2 + 0.5/9 = 4/9 = 0.4minutes.
The company’s goal is the mean absolute deviation is less than 0.5 minute.
Mean absolute deviation = 0.4minutes.
Yes, The driver did meet the company’s goal
Question 2.
Below are a different driver’s times on the same route. Find the mean and the MAD using a spreadsheet. Enter the data values into row 1 using cells A to I. Enter “mean =” into cell A2 and “MAD =” into cell A3. (Example 2)
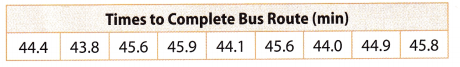
The mean is ___________ minutes, and the MAD is ____________ minutes.
This time, the bus driver did/did not meet the company’s goal.
Answer:
Given that the data of the times to complete the bus route is 44.4, 43.8. 45.6, 45.9, 44.1, 45.6, 44.0, 44.9, 45.8.
Mean = sum of the sum of the bus time to complete the round/number of the bus rounds to complete the round.
= 44.4 + 43.8 + 45.6 + 45.9 + 44.1 + 45.6 + 44.0 + 44.9 +45.8/9
=404.1/9
= 44.9
The mean absolute deviation is first to find the difference between the mean and each round.
44.4 – 44.9 = -0.5
43.8 – 44.9 = -1.1
45.6 – 44.9 = 0.7
45.9 – 44.9 = 1
44.1 – 44.9 = -0.8
45.6 – 44.9 = 0.7
44.0 – 44.9 = -0.9
44.9 – 44.9 = 0
45.8 – 44.9 = 0.9
Neglect the negative sign.
Mean absolute deviation = sum of the mean from each value/number of the mean from each value = 0.5 + 1.1 + 0.7 + 1 + 0.8 + 0.7 + 0.9 + 0 + 0.9/9 = 6.6/9 = 0.7
Essential Question Check-In
Question 3.
What is the mean absolute deviation and what does it tell you about data sets?
Answer:
The company’s goal is for the mean absolute deviation is less than 0.5 minutes.
Mean absolute deviation = 0.7minutes.
The driver did not meet the company’s goal.
Texas Go Math Grade 8 Lesson 15.1 Independent Practice Answer Key
Frank wants to know how many people live in each household in his town. He conducts a random survey of 10 people and asks how many people live in their household. His results are shown in the table.
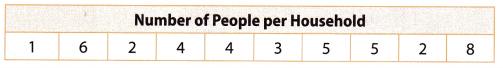
Question 4.
Calculate the mean number of people per household.
Answer:
Mean = sum of the people /number of the people
= 1 + 6 + 2 + 4 + 4 + 3 + 5 + 5 + 2 + 8/10
= 40/10 = 4
Mean number of the people per household = 4.
Question 5.
Calculate the MAD of the number of people per household.
Answer:
First subtract the mean from the given number of each person.
1 – 4 = -3
6 – 4 = 2
2 – 4 = -2
4 – 4 = 0
4 – 4 = 0
3 – 4 = -1
5 – 4 = 1
5 – 4 = 1
2 – 4 = -2
8 – 4 = 4
Negate the negative sign
Mean absolute deviation = sum of the difference of mean and each person/number of the people in the household.
= 3 + 2 + 2 + 0 + 0 + 1 + 1 + 1 + 2 + 4 /10
= 16/10
Mean absolute deviation = 1.6
Question 6.
What conclusions can you draw about the “typical” number of people in each household? Explain.
Answer:
3, 2, 2, 0, 0, 1, 1, 1, 2, 4 typical numbers of people in each household.
We get these numbers by finding the difference between the mean and each number of people per household.
Teachers are being trained to standardize the scores they give to students’ essays. The same essay was scored by 10 different teachers at the beginning and at the end of their training. The results are shown in the tables.
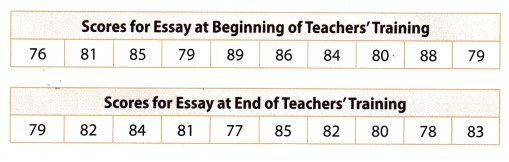
Question 7.
Calculate the MADs for the teachers’ scores. Did the teachers make progress in standardizing their scores?
Answer:
Given that the data of the scores for the essay at the beginning of teachers’ training are 76, 81, 85, 79, 89, 86, 84, 80, 88, and 79.
Mean = sum of the scores/number of the scores.
= 76 + 81 + 85 + 79 + 89 + 86 + 84 + 80 + 88 + 79 /10
= 827/10
= 82.7
Difference = each score – mean
76 – 82.7 = -6.7
81 – 82.7 = -1.7
85 – 82.7 = 2.3
79 – 82.7 = -3.7
89 – 82.7 = 6.3
86 – 82.7 = 3.3
84 – 82.7 = 1.3
80 – 82.7 = -2.7
88 – 82.7 = 5.3
79 – 82.7 = -3.7
Negate the negative signs.
Mean absolute deviation = sum of the difference/number of the difference.
= 6.7 + 1.7 + 2.3 + 3.7 + 6.3 + 3.3 + 1.3 + 2.7 + 5.3 + 3.7 /10
= 37/10 = 3.7
Mean absolute deviation of the scores for the essay at the beginning of teachers training is 3.7.
Given that the data of the scores for the essay at the end of teachers training is 79, 82, 84, 81, 77, 85, 82, 80, 78, 83.
Mean = sum of the scores/number of the scores.
= 79 + 82 + 84 + 81 + 77 + 85 + 82 + 78 + 83 / 10
=731/10
Mean = 73.1
Difference = each score – mean
79 – 73.1 = 5.9
82 – 73.1 = 8.9
84 – 73.1 =10.9
81 – 73.1 = 7.9
77 – 73.1 = 3.9
85 – 73.1 = 11.9
82 – 73.1 = 8.9
80 – 73.1 =6.9
78 – 73.1 =4.9
83 – 73.1 =9.9
Mean absolute deviation = sum of the difference /number of the differences.
5.9 + 8.9 + 10. 9 + 7.9 + 3.9 + 11.9 + 8.9 + 6.9 + 4.9 + 9.9 /10
= 80/10
=8
The mean absolute deviation of the scores for the essay at the end of the teacher’s training is 8.
Yes, the teachers make progress in standardizing their scores.
Question 8.
What If? What would it mean if the teachers had a MAD of 0?
Answer: Mean absolute deviation is 0. It means that there is no deviation, so the values are the same.
The annual rainfall for Austin, Texas, and San Antonio, Texas, in each of the years from 2002 to 2011 are shown in the tables. Use the data for 9-11.
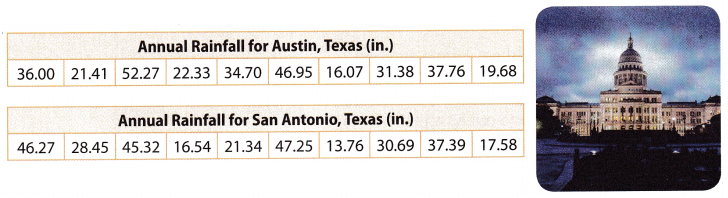
Question 9.
Use a spreadsheet to find the mean for the two cities’ annual rainfalls. In which city does it rain more in a year, on average?
Answer:
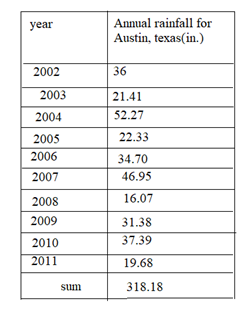
Mean of annual rainfall for Austin, Texas = sum of annual rainfall/number of years.
= 318.18/10
= 31.8
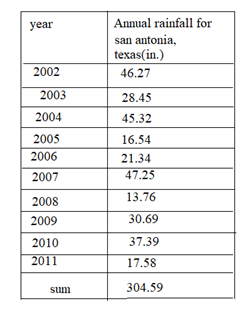
Mean of San Antonio, Texas = sum of annual rainfall/number of years
= 304.59/10
Mean of San Antonio, Texas = 30.45
Question 10.
Use your spreadsheet to find the MADs. Use the MADs to compare the distribution of annual rainfall for the two cities.
Answer:
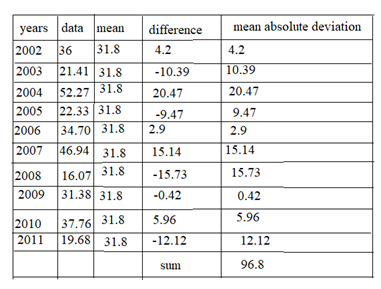
Mean of annual rainfall for Austin, Texas = sum of the deviations/number of the deviations
= 96.8/10
= 9.68
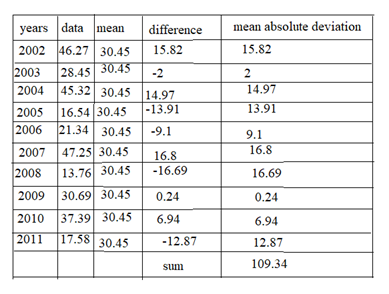
Mean absolute deviation of San Antonio, Texas = sum of the deviations/number of the deviations.
= 109.34/10
= 10.934
Question 11.
Make a Conjecture Does the information allow you to predict how the future amounts of rainfall for the two cities will compare? Explain.
Answer:
Mean of annual rainfall for Austin, Texas = 9.68
Mean absolute deviation of San Antonio, Texas = 10.93
The future rainfall in Austin, Texas is less than the Future rainfall in San Antonio, Texas.
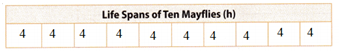
Question 12.
Critical Thinking The life spans of 10 adult mayflies have a mean of 4 hours and a MAD of 2 hours. Fill in the table below with possible values for the life spans. You can use the same value more than once.

Can any one of the 10 mayflies in the group live for 1 full day? Justify your answer.
Answer:
Given that,
Mean = 4 hours.
Mean absolute deviation = 2 hours.
Assume that the life spans of each fisv is 4 hours
Then mean = 4 + 4 + 4 + 4 + 4 + 4 + 4 + 4 + 4 + 4/10
= 40/10
= 4hours.
No fish can live for a full day.
H.O.T. Focus on Higher Order Thinking
Question 13.
Multistep In a spreadsheet, before entering any data values, first enter “mean =” into cell A2 and the formula =AVERAGE(A1 :J1) into cell B2. Next, enter “MAD =”into cell A3 and the formula =AVEDEV(A1:J1) into cell B3.You should see #DIV/0! in cell B2 and #NUM! in cell B3 as shown. Now do the following:
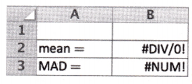
a. Enter “1” into cell A1. What do you get for the mean and the MAD of the data set? Explain why this makes sense.
Answer:
Given that,
0! = 1
Enter 1 into cell A1. then mean = 1/1 = 1
Mean absolute deviation = 1.
b. Enter “2” into cell B1. What do you get for the mean and the MAD of the data set this time? Explain why this makes sense.
Answer:
Given that
Enter 2 into cell A1. then mean = 2/1 = 2
Mean absolute deviation = 2.
c. Enter the numbers 3 through 10 into cells C1 to J1 and watch the mean and the MAD change. Do they increase, decrease, or stay the same? Explain why this makes sense.
Answer:
Given that,
Enter the numbers 3 through 10 into cells C1 to J1.
The mean = 0
The mean absolute deviation increases when the number increases.
Question 14.
Make a Conjecture Each of the values in a data set is increased by 10. Does this affect the MAD of the data set? Why or why not?
Answer:
Each of the values in the data set is increased by 10 then the values of the data increase. Then the mean absolute deviation of the data will not affect.
Question 15.
What If? Suppose a data set contains all negative numbers. Would the MAD for the data set also be negative? Explain.
Answer:
The data set contains all negative numbers also the mean absolute deviation is positive. Because the negative numbers cannot be eligible.
Must Read: