Refer to our Texas Go Math Grade 7 Answer Key Pdf to score good marks in the exams. Test yourself by practicing the problems from Texas Go Math Grade 7 Unit 6 Study Guide Review Answer Key.
Texas Go Math Grade 7 Unit 6 Study Guide Review Answer Key
Analyzing and Comparing Data
Texas Go Math Grade 7 Unit 6 Exercises Answer Key
Question 1.
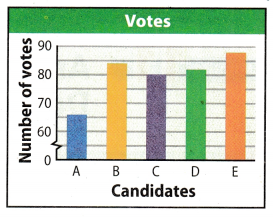
Five candidates are running for the position of School Superintendent. Find the percent of votes that each candidate received. (Lesson 11.1)
Answer:
Number votes A gets = 70
Number votes B gets = 84
Number votes C gets = 80
Number votes D gets = 82
Number votes E gets = 98
Total number of votes = 70 + 84 + 80 + 82 + 98 = 414
Percentage of votes of A = \(\frac{70}{414}\) × 100 = 16.90%
Percentage of votes of B = \(\frac{84}{414}\) × 100 = 20.29%
Percentage of votes of C = \(\frac{80}{414}\) × 10o = 19.32%
Percentage of votes of D = \(\frac{82}{414}\) × 100 = 19.80%
Percentage of votes of E = \(\frac{98}{414}\) × 100 = 23.67%
Percentage of vote A gets is 16.90%
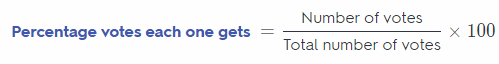
The dot plots show the number of hours a group of students spend online each week, and how many hours they spend reading. Compare the dot plots visually. (Lesson 11.2)
Question 2.
Compare the shapes, centers, and spreads of the dot plots.
Shape: ___________________
Center: _________________________
Spread: ______________
Answer:
Comparing the shapes, centers, and spreads of the dot plots:
Shape: In case of Online time most of the data are greater than 4 but in case of Reading time data is almost symmetric about the point 3.
Centre: Centre of the both given dot plot will be the median of both dot plot. Median or centre of Online time is 6
and the median or centre of Reading time is 5.
Spread: Spread of dot plot is the range of dot pot. Range of Online time is 7 – 0 = 7 and range of Reading time
is 6 – 0 = 6.
Median of Online time is 6 and of Reading time is 5.
Question 3.
Calculate the medians of the dot plots. _______
Answer:
Arranging Online time data: 0, 4, 4, 5, 5, 6, 6, 6, 6, 6, 6, 7, 7, 7, 7
Arranging Reading time data: 0, 0, 0, 0, 1, 1, 2, 5, 5, 5, 6, 6, 6, 6, 6
We know that when total number of given data in a sample is “n” and it is an odd number then the median is the \(\frac{(n+1)}{2} t h\) term after arranging the data in increasing order. In above given dot plot total number of data is 15. So, \(\frac{15+1}{2}\) = 8th term will be the median of both the dot plots.
Median of Online time = 6
Median of Reading time = 5
Medians of dot plots are 6 and 5
Question 4.
Calculate the ranges of the dot plots. _______
Answer:
For Online Time:
Maximum value = 7
Minimum value = 0
Range = Maximum value – Minimum value = 7 – 0 = 7
For Reading Time:
Maximum value = 6
Minimum value = 0
Range = Maximum value – Minimum value = 6 – 0 = 6
Hence, range of online time is 7 hrs and range of reading time is 0 hrs.
Range of online time is 7 hrs and range of reading time is 6 hrs.
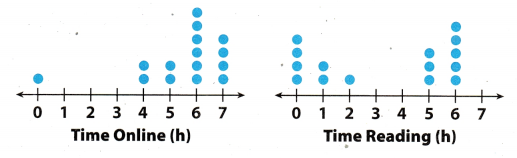
The box plots show the math and reading scores on a standardized test for a group of students. Use the box
plots shown to answer the following questions.
Question 5.
Compare the maximum and minimum values of the box plots.
Answer:
For math score:
Maximum value = 20
Minimum vaLue = 4
Range = Maximum value – Minimum value = 20 – 4 = 16
For Reading score:
Maximum value = 20
Minimum vaLue = 4
Range = Maximum value – Minimum value = 20 – 4 = 16
On comparing both the box plot we can see that Minimum and maximum value of both are same so their range are also same. Median of math score is 8 and median of reading score is 14.
Maximum and minimum value of both box plot are same
Question 6.
Compare the interquartile range of the box plots.
Answer:
For math score:
Lower interquartile (Q1) = 14
Upper interquartile (Q2) = 6
interquartie Range = Q2 – Q1 = 14 – 6 = 8
For Reading score:
Lower interquartile (Q1) = 18
Upper interquartile (Q2) = 10
interquartile Range = Q2 – Q1 = 18 – 10 = 8
On comparing both the box plot we can see that their interquartite range are also same.
Random Samples and Populations
Question 1.
Molly uses the school directory to select 25 students at random from her school for a survey on which sports people like to watch on television. She calls the students and asks them, “Do you think basketball is the best sport to watch on television?” (Leson 12.1)
a. Did Molly survey a random sample or a biased sample of the students at her school?
Answer:
It is given in problem that Molly uses the school, directory to select 25 students for her survey. She select students
randomly from the school directory. So every student of school have an equal chance of being selected and we
know that the sample in which every person or object has an equal chance of being selected is called as random
sample. Hence, Molly survey a random sample of students at her school.
b. Was the question she asked an unbiased question? Explain your answer.
Answer:
The question asked by Molly is “Do you think basketball is best sports to watch on television?” Here she has
already mentioned the basketball sports so every other sports wilL not have equal chance of being seLected. And
we know that a sample in which every person, object, or event does not have equal chance of being selected is
called as biased sample. Hence, question asked by Molly is not unbiased.
Yes Molly survey a random sample
Question 2.
There are 2,300 licensed dogs in Clarkson. A ràndom sample of 50 of the dogs in Clarkson shows that 8 have ID microchips implanted. How many dogs in Clarkson are likely to have ID microchips implanted? (Lesson 1 2.2)
Answer:
Total number of licensed dogs = 2,300
Number of dogs in random sample = 50
Number of dogs with ID microchips = 8

Hence, 368 dogs in Clarkson are likely to have ID microchips implanted.
Question 3.
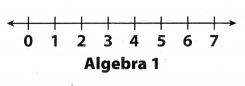
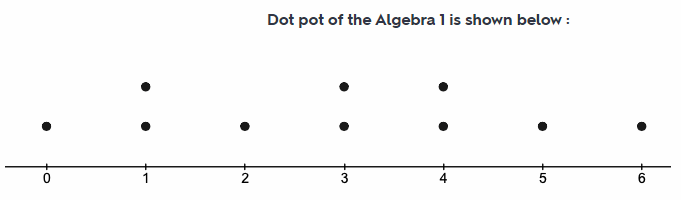
Mr. Puccia teaches Algebra 1 and Geometry. He randomly selected 10 students from each class. He asked the students how many hours they spend on math homework in a week. He recorded each set of data in a list. (Lesson 12.3)
Algebra 1: 4, 0, 5, 3, 6, 3, 2, 1, 1, 4
Geometry: 7, 3, 5, 6, 5, 3, 5, 3, 6, 5
a. Make a dot plot for Algebra 1. Then find the mean and the range for Algebra 1.
Answer:
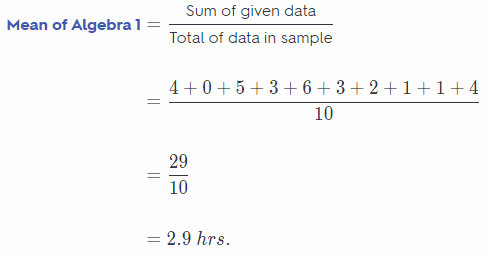
Minimum value of Algebra 1 = 0
Maximum valueof Algebra 1 = 6
Range of Algebra 1 = Maximum value – Minimum value
= 6 – 0
= 6
b. Make a dot plot for Geometry. Then find the mean and the range for Geometry.
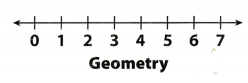
Answer:
Minimum value of Geometry 1 = 3
Maximum valueof Geometry 1 = 7
Range of Geometry 1 = Maximum value – Minimum value
= 7 – 3
= 4
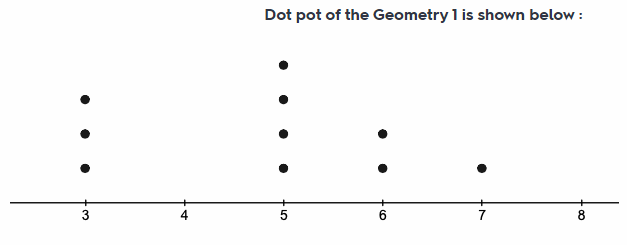
c. What can you infer about the students in the Algebra 1 class compared to the students in the Geometry class?
Answer:
Mean of geometry 1 is greater than algebra 1 this means that the students spends more hours on geometry 1 as
compared to the algebra 1 for their math homework. And the range or spread of data is more in case of aLgebra 1
as compared to the geometry 1.
Mean of algebra 1 is 2.9 hrs and of geometry 1 is 4 hrs.
Texas Go Math Grade 7 Unit 6 Performance Tasks Answer Key
Question 1.
CAREERS IN MATH Entomologist An entomologist is studying how two different types of flowers appeal to butterflies. The box-and-whisker plots show the number of butterflies who visited one of two different types of flowers in a field. The data were collected over a two-week period, for one hour each day.
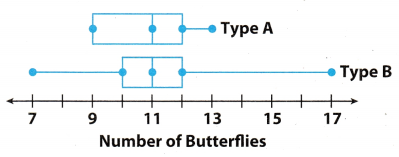
a. Find the median, range, and interquartile range for each data set.
Answer:
In box plot representation the middle point of box is median point and left and right point of box is lower and
upper quartile respectively.
For type A :
Median = Middle point of box
= 11
Maximum value = 13
Minimum value = 9
Range = Maximum vaLue – Minimum value
= 13 – 9
= 4
Lower quartile = 9
Upper quartile = 12
Interquartile Range = Upper quartile – lower quartile
= 12 – 9
= 3
Fortype B:
Median = Middle point of box
= 11
Maximum value = 17
Minimum vaLue = 7
Range = Maximum value – Minimum vaWe
= 17 – 7
= 10
Lower quartile = 10
Upper quartile = 12
Interquartite Range = Upper quartile – Lower quartile
= 12 – 10
= 2
b. Which measure makes it appear that flower type A had a more consistent number of butterfly visits? Which measure makes it appear that flower type B did? If you had to choose one flower as having the more consistent visits, which would you choose? Explain your reasoning.
Answer:
We can see that range of type A flower is 4 and of type B flower is 10 Range of type A flower is less as compared
to type B flower so we can say that type A flower had more consistent number of butterflies visit
We can see that interquartiLe range of type B flower is 2 and of type A flower is 3 Interquartile range of type B
flower is less as compared to type A flower so we can say that type B flower had more consistent number of
butterflies visit.
Hence, median of both type A and type B fLower is same which is 11 but the range of type A flower is very Less as compared to type B flower. In case of type A flower spread of data is less as most of the data are near its centre as median point. So i will choose type A flower as having more consistent visit.
I will choose type A flower as having more consistent visit.
Texas Go Math Grade 7 Unit 6 Mixed Review Texas Test Prep Answer Key
Selected Response
Question 1.
Which is a true statement based on the dot plots below?
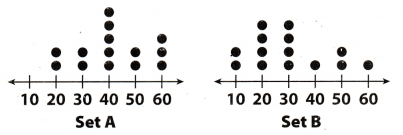
(A) Set B has the greater range.
(B) Set B has the greater median.
(C) Set B has the greater mean.
(D) Set A is less symmetric than Set B.
Answer:
(A) Set B has the greater range.
We know that Range = Maximum value – Minimum value
For set A:
Maximum value = 60
Minimum value = 20
Range of set A = 60 – 20 = 40
For set B:
Maximum value = 60
Minimum value = 10
Range of set B = 60 – 10 = 50
So, set B has greater range than set A
Hence, option A is correct answer.
Question 2.
Which is a solution to the equation 7g – 2 = 47?
(A) g = 5
(B) g = 6
(C) g = 7
(D) g = 8
Answer:
(C) g = 7
Given equation in problem: 7g – 2 = 47
7g – 2 = 49 (Given)
7g – 2 + 2 = 47 + 2 (Adding 2 on both side)
7g = 49 (Simplifying)
g = \(\frac{49}{7}\) (Dividing both side by 7)
g = 7 (Solution)
Hence, option C is correct answer.
Question 3.
Which is a true statement based on the box plots below?
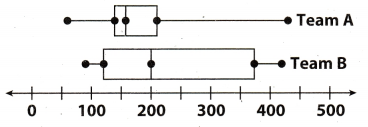
(A) The data for Team B have the greater range.
(B) The data for Team A are more symmetric.
(C) The data for Team B have the greater interquartile range.
(D) The data for Team A have the greater median.
Answer:
(C) The data for Team B have the greater interquartile range.
In boxplot representation of data the box represent the interquartile range. First or left end of the box is called the
lower quartile (Q1) and the second or right end of box is called the upper quartile (Q2). So the quartile range is the difference of upper quartile and lower quartile (Q2 – Q1). So if box is larger in length means interquartile range is greater as compared to the box having smaller Length.
Now on comparing the boxplot of team A and team B we can see that the box length of team B is larger as compared to the team A. So the interquartile range of team B will be more than team A.
Hence, option C is correct answer.
Question 4.
Which is a random sample?
(A) 10 students in the Spanish Club are asked how many languages they speak.
(B) 20 customers at an Italian restaurant are surveyed on what their favorite food is.
(C) 15 students were asked what their favorite color is.
(D) 10 customers at a pet store were asked whether or not they had pets.
Answer:
(C) 15 students were asked what their favorite color is.
Random Sample : A sample in which every person, object or event has an equal chance of being selected is called as the Random Sample.
So incase of option C there are 15 students who are being asked that “what is there favourite colour”. Here in asked question name of any colour is not mentioned. Hence each colour has equal chance of being selected in the sample. Thus this sample will be random sample.
Hence, option C is correct answer
Question 5.
Find the percent change from 84 to 63.
(A) 30% decrease
(B) 30% increase
(C) 25% decrease
(D) 25% increase
Answer:
Origina[ value = 84
New value = 63
Changed value = 63 – 84 = – 21
Negative sign means the new value has decreased from original value.
Hence, option C is correct answer.
Question 6.
A survey asked 100 students in a school to name the temperature at which they feel most comfortable. The box plot below shows the results for temperatures in degrees Fahrenheit. Which could you infer based on the box plot below?
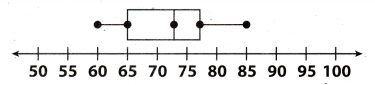
(A) Most students prefer a temperature less than 65 degrees.
(B) Most students prefer a temperature of at least 70 degrees.
(C) Almost no students prefer a temperature of less than 75 degrees.
(D) Almost no students prefer a temperature of more than 65 degrees.
Answer:
(B) Most students prefer a temperature of at least 70 degrees.
In boxplot representation of data the box has 3 points first and third points are the lower quartile and upper
quartile respectively and the middle point of box is the median And we know that median is the almost centre
point of the data around which the values of other data lies.
So, when we observe the given boxplot we can see that centre point of box or median is 73 which means that the values of most of the data are around 73. Hence we can say that most of the students prefer a temperature of at least 70 degrees.
hence, option B is correct answer.
Question 7.
The box plots below show data from a survey of students under 14 years old. They were asked on how many days in a month they read and draw. Based on the box plots, which is a true statement about students?
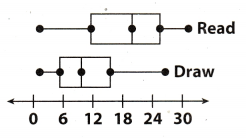
(A) Most students a month.
(B) Most students a month.
(C) Most students they draw.
(D) Most students they read.
Answer:
(C) Most students they draw.
In boxplot representation of data the box has 3 points first and third points are the lower quartile and upper quartile respectively and the middle point of box is the median And we know that median is the almost centre
point of the data around which the values of other data lies.
Now on comparing the boxplot of Read and Draw we can see that the median or centre point of Read is greater than 18 and median or centre point of Draw is less than 12. And also box length of Read is larger as compared to the draw. So now we can say that most of the students read more often than they draw.
Hence, option C ¡s correct answer.
Hot tip!
Use logic to eliminate answer choices that are incorrect. This will help you to make an educated guess if you are having trouble with the question.
Question 8.
Which describes the relationship between ∠NOM and ∠JOK ¡n the diagram?
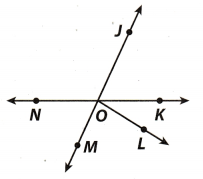
(A) adjacent angles
(B) complementary angles
(C) supplementary angles
(D) vertical angles
Answer:
In given figure when we observe line JM and NK we can see that ∠NOM and ∠JOK are just opposite of each
other and vertex point of both angle is point O. So ∠NOM and ∠JOK are vertically opposite angle and both
vertically opposite angLe will be equal in magnitude.
∠NOM = ∠JOK
Hence, option D will be correct answer.
Gridded Response
Question 9.
Katie is reading a 200-page book that is divided into five chapters. The bar graph shows the number of pages in each chapter.

What percent of the pages are in Chapter 2?
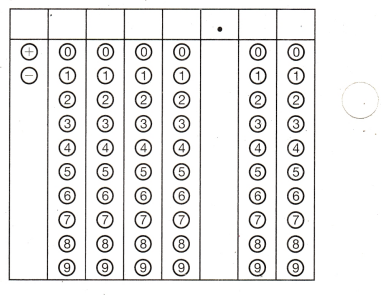
Answer:
Total number of pages in book that Katie is reading = 200
Number of pages in chapter 2 of book = 30
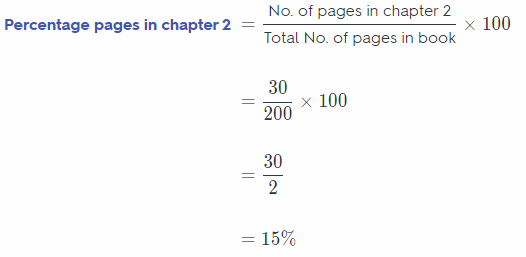
Hence, 15% of pages are in the chapter 2 of book.
Steps for marking the given box:
1st column : mark + sign
2nd column: mark 0
3rd column : mark 0
4th column: mark 1
5th column : mark ‘5
6th column : mark t,
7th column : mark ‘0’
Question 10.
Lee Middle School has 420 students. Irene surveys a random sample of 45 students and finds that 18 of them have pet cats. How many students are likely to have pet cats?
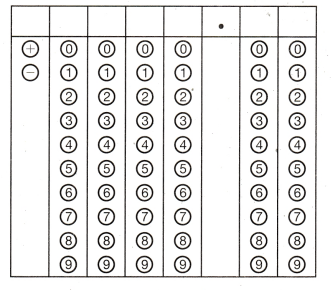
Answer
Total number of students in Lee middle school = 420
Number of students in random sample = 45
Number of students who have pet cats = 18
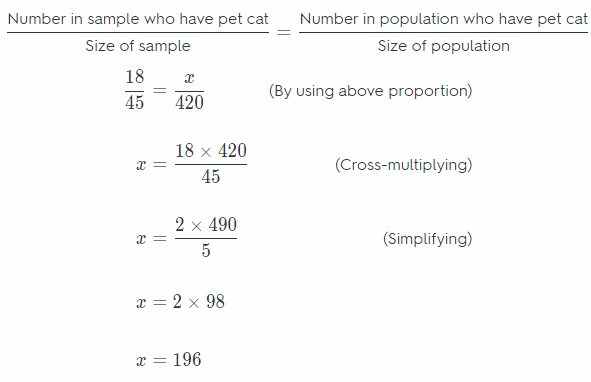
So, 196 students in Lee middle school have pet cats
Step 2
Steps for marking the given box:
1st column : mark ‘+’ sign
2nd column : mark ‘0’
3rd column : mark ‘1’
4th column: mark ‘9’
5th column : mark ‘6’
6th column: mark ‘0’
7th column : mark ‘0’
Texas Go Math Grade 7 Unit 6 Vocabulary Preview Answer Key
Use the puzzle to preview key vocabulary from this unit. Unscramble the circled letters to answer the riddle at the bottom of the page.
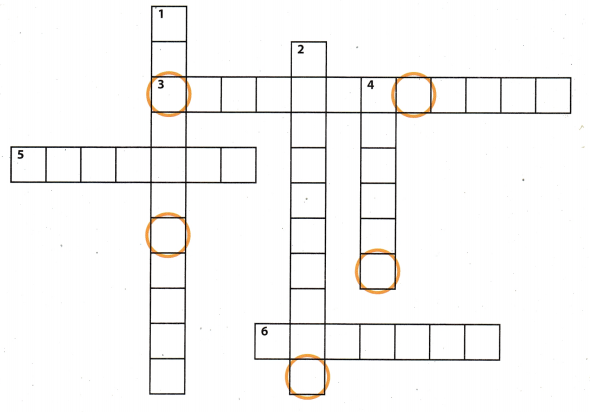
Across
3. A sample in which every person, object, or event has an equal chance of being selected (2 words). (Lesson 12.1)
5. A display that shows how the values in a data set are distributed (2 words). (Lesson 11.3)
6. A display in which each piece of data is represented by a dot above a number line (2 words). (Lesson 11.2)
Down
1. A round chart divided into pieces that represent a portion of a set of data (2 words). (Lesson 11.1)
2. The entire group of objects, individuals, or events in a set of data. (Lesson 12.1)
4. Part of a population chosen to represent the entire group. (Lesson 12.1)
Q: Where do cowboys who love statistics live?
A: onthe ___ ___ ___ ___ !