Refer to our Texas Go Math Grade 7 Answer Key Pdf to score good marks in the exams. Test yourself by practicing the problems from Texas Go Math Grade 7 Module 12 Quiz Answer Key.
Texas Go Math Grade 7 Module 12 Quiz Answer Key
Texas Go Math Grade 7 Module 12 Ready to Go On? Answer Key
12.1 Populations and Samples
Question 1.
A company uses a computer to identify their 600 most loyal customers from its database and then surveys those customers to find out how they like their service. Identify the population and determine whether the sample is random or biased.
Answer:
It is given in the problem that company uses the database from computer to identify their 600 most loyal customers so here all the customers in database will be Population and 600 loyal costumers will be the sample.
Also it is mentioned that company are identifying the 600 most loyal costumers so the sample will be biased sample. Because the identification of loyal costumers will be done on certain condition, hence each customer will not get equal chance for being loyal costumer.
All the costumers in database will be population.
12.2 Making Inferences from a Random Sample
Question 2.
A university has 30,330 students. In a random sample of 270 students, 18 speak three or more languages. Predict the number of students at the university who speak three or more languages. ____
Answer:
Total number of students in university = 30,330
Number of students in random sample = 270
Number of students who speak 3 or more Language = 18
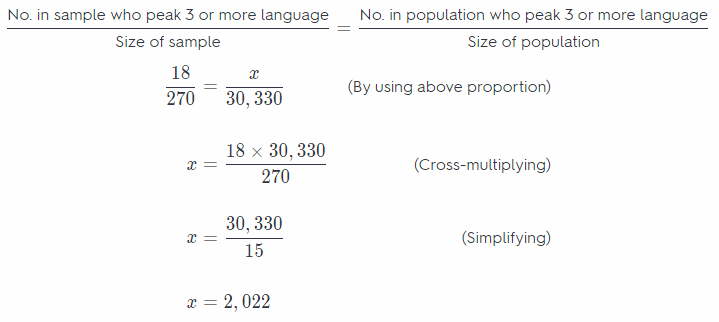
Hence, 2,022 students in university can speak 3 or more language.
12.3 Comparing Populations
Question 3.
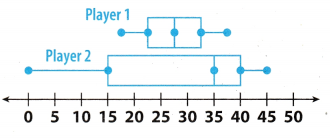
The box plot shows data that was collected on two basketball players over 20 randomly selected games in order to analyze the number of points each player has scored per game over his career. Make an inference from this data.
Answer:
Comparing the Boxplot of player 1 and Player 2 :
⇒ Length of box and whisker of player 1 is smaller as compared to the player 2.
⇒ Median of points of player 1 is 27 which is less as compared to the median of player 2 is 35. This means median point of player 2 is 7 more than player 1.
⇒ Range of player 1 = 38 – 17 = 21 and the Range of player 2 = 45 – 0 = 45.
⇒ Points of player 1 are lesser spread as compared to the points of second player.
Length of box and whisker of player 1 is smaller as compared to the player 2.
Essential Question
Question 4.
How can you use random samples to compare populations and make inferences?
Answer:
We can use the data from a random sample for comparing the population and making interference. Random
samples are more likely to contain data that can be used to make predictions about a whole population. The size of a sample influences the strength of the inference about the population. we can also use proportion formula for
comparing the population.
Random sample can be used to compare populations.
Texas Go Math Grade 7 Module 12 Mixed Review Texas Test Prep Answer Key
Selected Response
Question 1.
The box plot shows the results from a survey in which 50 of the school’s 7th graders were asked about their height. Which could you infer based on the box plot below?
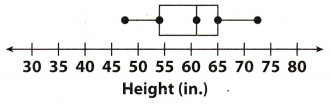
(A) Most 7th graders are at least 65 inches tall.
(B) Most 7th graders are at least 54 inches tall.
(C) Almost no 7th graders are less than 60 inches tall.
(D) Almost no 7th graders are more than 60 inches tall.
Answer:
(B) Most 7th graders are at least 54 inches tall.
When we observe the given boxplot we can see that centre of box or median is 61 and the lower quartile is 54 and upper quartile is 65. Here lower quartile is 54 which means that only 25% or less 7th grade students are shorter than 54 inch. Hence at least 75% students are at least 54 inch taller So we can say that most 7th graders are at least 54 inches tall.
hence, option B is correct answer.
Question 2.
A middle school has 490 students. Mae surveys a random sample of 60 students and finds that 24 of them have pet dogs. How many students are likely to have pet dogs?
(A) 98
(B) 196
(C) 245
(D) 294
Answer:
(B) 196
Total number of students in middle school = 490
Number of students in random sample = 60
Number of students who have pet dogs = 24
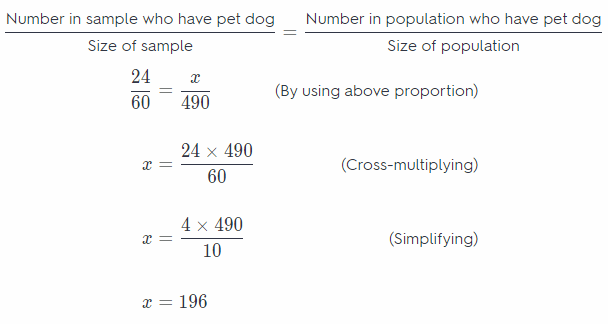
so, 192 students in middle school have pet dogs
Hence, option B is correct answer
Question 3.
Caitlyn finds that the experimental probability of her making a three-point shot is 30%. Out of 500 three-point shots, about how many could she predict she would make?
(A) 100
(B) 115
(C) 125
(D) 150
Answer:
(D) 150
Experimental probability of making three-point = 30%
Total number of three-point shots = 500
Number of shots Caitlyn can predict = \(\frac{\% \text { of 3-point shots }}{100}\) × Total number of shots
= \(\frac{30}{100}\) × 500
= 0.3 × 500
= 150
So, Caitlyn can predict she would make 150 three-point shots.
Hence, option D is correct answer.
Question 4.
Which of the following is a random sample?
(A) A radio DJ asks the first 10 listeners who call in if they liked the last song.
(B) 20 customers at a chicken restaurant are surveyed on their favorite food.
(C) Members of a polling organization survey 800 registered voters by randomly choosing names from a list of all registered voters.
(D) Rebecca used an email poll to survey 100 students about how often they use the internet.
Answer:
(C) Members of a polling organization survey 800 registered voters by randomly choosing names from a list of all registered voters.
Random sample : A sample in which every person, object, or event has an equal chance of being selected is called as the Random Sample.
So incase of option C there are total 800 registered voters who are being surveyed by polling organisation but they are choosing the vote randomly from the list. Hence out of 800 voters each one has an equal chance of being selected for the survey. Thus this sample will be random sample.
Hence, option C is correct answer.
Gridded Response
Question 5.
Mary wanted to know the amount of time 7th grade students spend on homework each week, so she surveyed 20 students at random. The results are shown below.
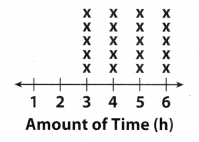
There are 164 students in the 7th grade. Predict how many 7th grade students spend 5 hours on homework in a week.
Answer:
Total number of students in 7th grade = 164
Number of students in random sample = 20
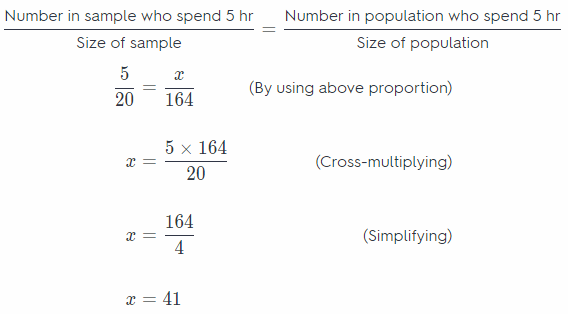
Hence, 41 students of 7th grade spends 5 hours on homework.
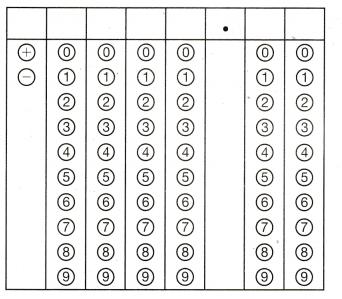
Steps for marking the given box:
1st column : mark ‘+’ sign
2nd column: mark ‘0’
3rd column : mark ‘0’
4th column: mark ‘4’
5th column : mark ‘1’
6th column : mark ‘0’
7th column : mark ‘0’
41 students of 7th grade spends 5 hours on homework.