Refer to our Texas Go Math Grade 7 Answer Key Pdf to score good marks in the exams. Test yourself by practicing the problems from Texas Go Math Grade 7 Lesson 11.1 Answer Key Analyzing Categorical Data.
Texas Go Math Grade 7 Lesson 11.1 Answer Key Analyzing Categorical Data
Texas Go Math Grade 7 Lesson 11.1 Explore Activity Answer Key
Solving Problems Involving Bar Graphs
The students in a class were surveyed to find out how many people live in their households. Household members might include parents, step parents, guardians, and siblings, as well as extended family, such as grandparents. The results of the survey are shown in the dot plot.

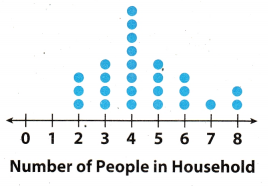
A. How many students were surveyed? How do you know?
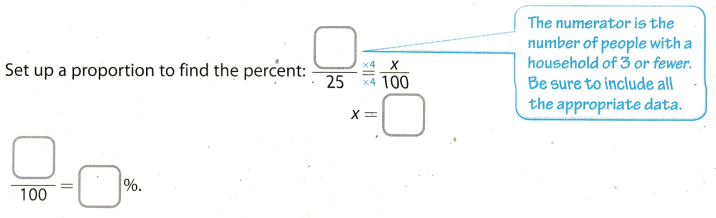
B. What percent of the class has a household of 3 or fewer people?
Reflect
Question 1.
Critical Thinking What percent of households with 4 or fewer people have exactly 2 people?
Answer:
Total number family with 4 or fewer people = 15
Number of family with exactly two people = 3
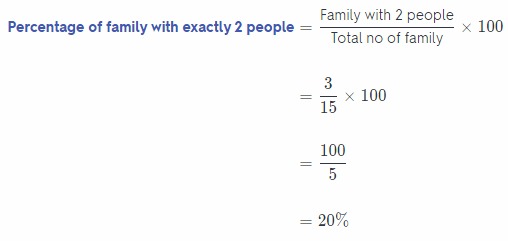
Hence, 20% of family have exactly 2 people among family having 4 or fewer people.
Example 1.
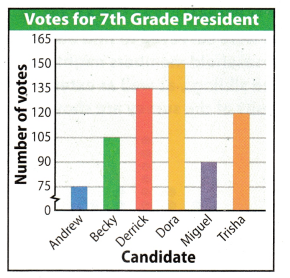
Three boys and three girls ran for 7th grade class president. The boys are Andrew, Derrick, and Miguel. The girls are Becky, Dora, and Trisha. The results of the election are shown in the bar graph. Which is greater – the percent of total votes for boys that Derrick received, or the percent of total votes for girls that Dora received?
Step 1:
Calculate the percent of total votes for boys that Derrick received. Set up a ratio:
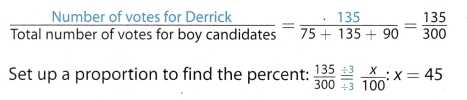
Derrick received 45% of the total votes for boys.
Step 2:
Calculate the percent of total votes for girls that Dora received. Set up a ratio:
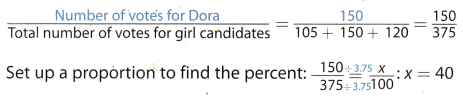
Dora received 40% of the total votes for girls.
Step 3
Compare the percents calculated in the previous two steps.
Because 45% is greater than 40%, the percent of votes for boys that Derrick received is greater.
Your Turn
Question 2.
In Example 1, Calculate the percent of total votes that Dora received.
Answer:
Calculate the percent of total votes that Dora received.
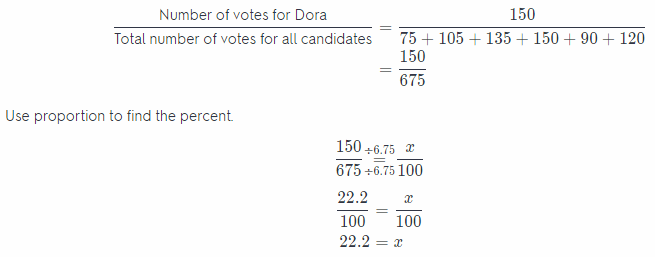
Dora received 22.2% of the total votes for all canditates.
Example 2.
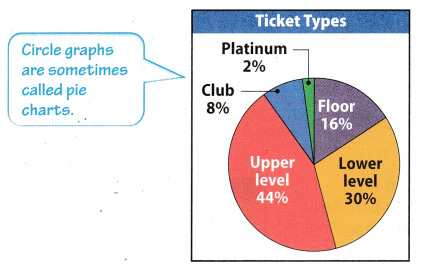
There are 5,000 tickets available for a concert. The percent of available tickets belonging to each ticket type is shown in the circle graph. Calculate the number of tickets available for each type of ticket.
Step 1
Write a ratio to represent each type of ticket.
Floor: 16% = \(\frac{16}{100}\)
Lower level: 30% = \(\frac{30}{100}\)
Platinum: 2% = \(\frac{2}{100}\)
Upper level: 44% = \(\frac{44}{100}\)
Club: 8% = \(\frac{8}{100}\)
Step 2:
Set up and solve a proportion to find the number of each type of ticket.
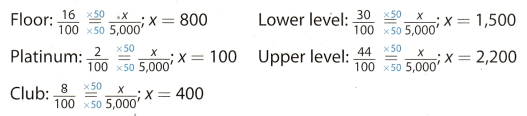
The floor has 800 tickets, the lower level has 1,500, the upper level has 2,200, the club has 400, and the platinum section has 100.
Your Turn
Question 3.
What percentage of sold tickets not on the floor were platinum tickets? Round to the nearest percent.
Answer:
Total number of tickets of concert = 5,000
Number of Platinum ticket = 100
Number tickets on floor = 800
Number of non-floor ticket = 5,000 – 800 = 4,200
% of platinum ticket which are not on floor = \(\frac{100}{4200}\) × 100
= \(\frac{100}{42}\)
= 2.38%
Hence, 2.38% of non-floor ticket were platinum ticket.
Texas Go Math Grade 7 Lesson 11.1 Guided Practice Answer Key
Question 1.
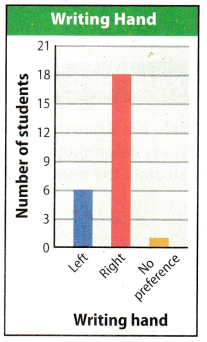
The students in a class were asked which hand they preferred to use for writing. The bar graph shows the results. Of the students who had a preference, what percent chose the left hand? (Example 1)
Step 1
Find the total number of students who had a preference.
Left ___ Right ___ Total ____
Step 2:
Set up a proportion and find the percent.
________
Answer:
Left = 6
Right = 18
Total = 6 + 18 = 24
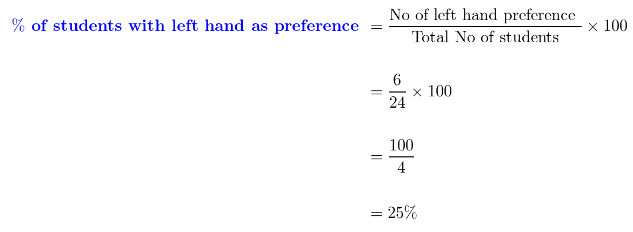
Hence, 25% of students have left hand as preference.
Question 2.
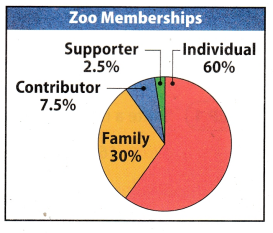
There are 20,000 members of a zoo. The percent of members having each membership type is shown in the circle graph. How many members have a contributor membership? What percentage of the noncontributory memberships are individual memberships? Round to the nearest percent. (Example 2)
Answer:
Total number of membership of zoo = 20,000
Percentage of contributor membership = 7.5%
Percentage of individual membership = 60%
Number member with contributor membership = \(\frac{7.5}{100}\) × 20,000
= 0.075 × 20,000
= 1500
Number member with individual membership = \(\frac{60}{100}\) × 20,000
= 0.6 × 20,000
= 12,000
Number of noncontributory membership = 20,000 – 1500 = 18,500
Percent of noncontributory who are individual = \(\frac{12000}{18500}\) × 100
= 0.6486 × 100
= 64.86%
Essential Question Check-In
Question 3.
When solving proportions based on data from graphs, why do you often convert from fractions and percents to decimals?
Answer:
When solving proportions based on data from graphs, we do often convert from fractions and percents to decimals because decimals are way to represent the fraction and percentage. When the fraction are calculated further we get decimal values and when it is multiplied by 100 we get the values in percentage (%)
Thus it helps in simplifying the calculation of problems.
Decimals helps in simplifying the calculation of problems.
Texas Go Math Grade 7 Lesson 11.1 Independent Practice Answer Key
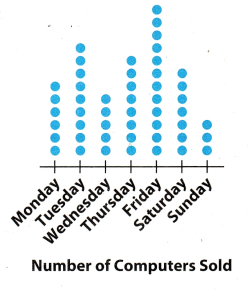
The number of computers sold at an electronics store for each day of a week is shown in the dot plot.
Question 4.
What percent of all computers sold during the entire week were sold on Friday?
Answer:
The number of computers sold in each day in week:
Monday: 6
Tuesday: 9
Wednesday: 5
Thursday: 8
Friday: 12
Saturday: 7
Sunday: 3
Total of sold computers is 50.
Set up a proportion:

To find a percent of sold computers in friday, divide x by 100. Add a “%“ sign.
\(\frac{x}{100}\) = \(\frac{24}{100}\) = 0.24%
The percent of all computers sold in Friday is 0.24%
Question 5.
What percent of computers sold on weekdays were sold on Tuesday? Round to the nearest percent.
Answer:
Total of sold computers is 50.
The number of sold computers on Tuesday is 9.
Set up a proportion:

To find a percent of sold computers on Tuesday, divide x = 18 by 100 Add a “%“ Sign.
\(\frac{x}{100}\) = \(\frac{18}{100}\) = 0.18 ≈ 0.2%
A percent of sold computers on Tuesday is 0.2%.
Question 6.
Multiple Representations Suppose the data described above for the electronics store were represented with a bar graph instead of a dot plot. Would there be any advantages or disadvantages?
Answer:
Both bar graph and dot plot have their own advantages and disadvantages depending on the person who uses it Both a bar graph and a dot plot are easier to be interpreted since the data are easily laid out However, for some,
they prefer a bar graph over a dot plot because n a bar graph, the actual numbers can be shown (the y-axis of the
graph) unlike in the dot plot that you just count the dots in order to determine the result.
Both bar graph and dot plot have their own advantages and disadvantages depending on the person who uses it.
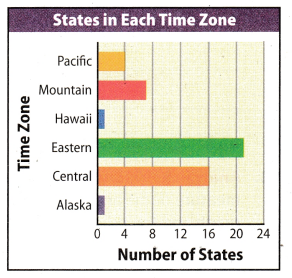
The number of states in the United States that are primarily in each of the time zones is shown in the bar graph.
Question 7.
The continental United States is all states except Hawaii and Alaska. What percent of the continental states are primarily in the Eastern time zone?
Answer:
Calculate the percent of total continental states which are primarily in the Eastern time zone.
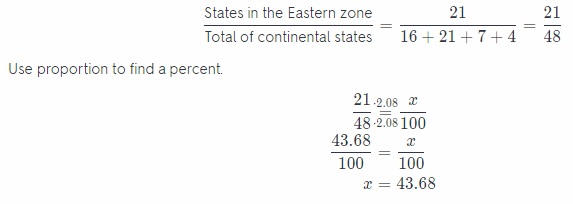
The percent of the continental states in the Eastern time zone is 43.68 %.
Question 8.
Is the percent of the continental states primarily in the Eastern time zone greater than or less than the percent of
all states that are in the Mountain or Central time zone?
Answer:
Calculate the percent of total continental states which are primarily in the Mountain and Central zone.
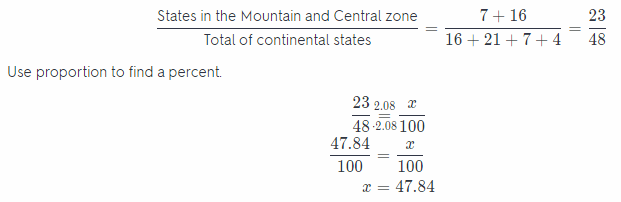
In percent of the continental states in the Eastern time zone is less than the percent of all continental states that are in the Mountain and Central time zone.
Question 9.
What If? Suppose the horizontal scale of the bar graph had intervals of 1 instead of 4. Would there be any advantages to having that scale? Would there be any disadvantages?
Answer:
The spread of the dot plots are:
- The data is almost equally distributed on both the side of centre which is “6”
- All the data is between 3 to 9
- Range of the given dot plot: 9 – 3 = 6
Range of given dot plot is 6
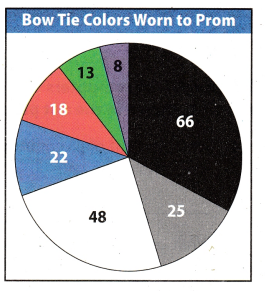
All of the boys attending a prom wore a tuxedo. The circle graph shows the number of boys wearing each of the different bow tie colors.
Question 10.
Make a Conjecture Estimate the percent of boys wearing black bow ties by comparing the black section of the graph to the whole graph.
Answer:
Calculate the percent of boys wearing black bow ties.
Boys wearing black bow ties 66 66
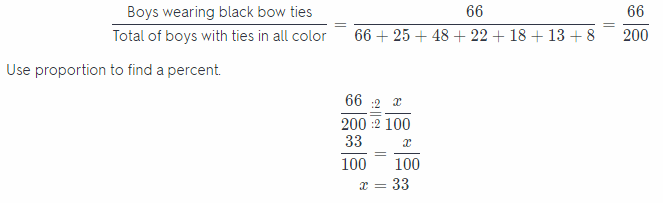
The percent of boys wearing black bow ties is 33 %.
Question 11.
Calculate the percent of boys wearing each bow tie color. How does the percent wearing black bow ties compare to your estimate?
Answer:
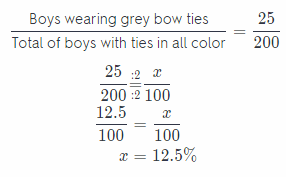
Calculate the percent of boys wearing grey bow ties.
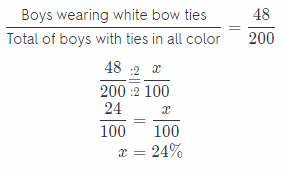
Calculate the percent of boys wearing white bow ties.
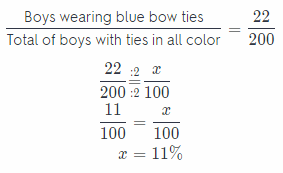
Calculate the percent of boys wearing blue bow ties.
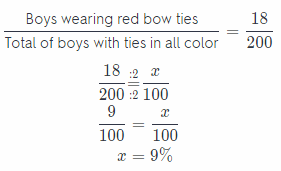
Calculate the percent of boys wearing red bow ties.
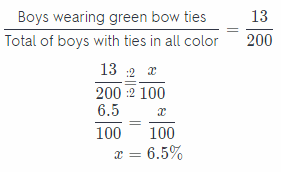
Calculate the percent of boys wearing green bow ties.
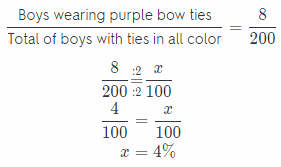
Calculate the percent of boys wearing purple bow ties.
Grey bow ties: 12.5 %
White bow ties: 24 %
Blue bow ties: 11 %
Red bow ties: 9 %
Green bow ties: 65 %
Purple bow ties: 4 %
The percent of black bow ties is bigger than the percent of bow ties in others colors.
H.O.T. Focus on Higher Order Thinking
Question 12.
Communicate Mathematical Ideas A dot plot shows the number of pizzas sold at a local restaurant each day one week. One column of dots on the plot is much taller than the others. Explain what that means in the context of the data and of percents. Then describe how that same category would be noticeable on a circle graph of the same data.
Answer:
If one column of dots on the plot is much taller than the others column this means on that particular day of week
number of pizza sold at local restaurant is maximum as compared to the other days of week. So in a week the local restaurant sell heighest number of pizza on day that. Also in terms of percentage maximum percentage of pizza is sold on that day.
If same data is plotted on the circle graph than that particular day will have maximum area on the circle and the circle will be dividend in the number of days.
If one column of dots on the plot is much taller than the others column this means on that particular day of week number of pizza sold at local restaurant is maximum.
Question 13.
Analyze Relationships What is the relationship between the degree measure of the angle formed by the straight edges of a section of a circle graph and the percent of the data that the section represents?
Answer:
The relationship between the degree measure of the angle formed by the straight edges of a section of a circle
graph and the percentage of the data that the section represents are that both are directly proportional. If the
percentage of data is maximum then the angle formed in circle will be also maximum and if percentage of data is
minimum then the angle formed by circle will be also minimum.
Relation between angle of circle and percents of data is:
⇒ 100% = 360°
⇒ 1% = \(\frac{360^{\circ}}{100}\)
⇒ 1% = 3.6°
1% of data is equal to 3.6° on circle.
Question 14.
Multiple Representations A bar graph has 8 bars, all the same height. Suppose that a circle graph were used instead of a bar graph to represent the data. What percent ofthe data would each piece represent?
Answer:
It is given in the problem that there are 8 bars on bar graph and of equal height. So each bar will represent equal
percentage of the data. Hence in circle graph the circle will be divided in 8 equal parts and each single part will represent a bar of bar graph. We know that a complete circle is of 360°, so the single part of circle will \(\frac{360}{8}\) = 45°
Now finding each part of data (45°) in percentage:
360° = 100%
1° = \(\frac{100}{360} \%\)
So, 45° = \(\frac{100}{360}\) × 45%
= 12.50%
Hence, each piece wilt represent 12.50% of data.
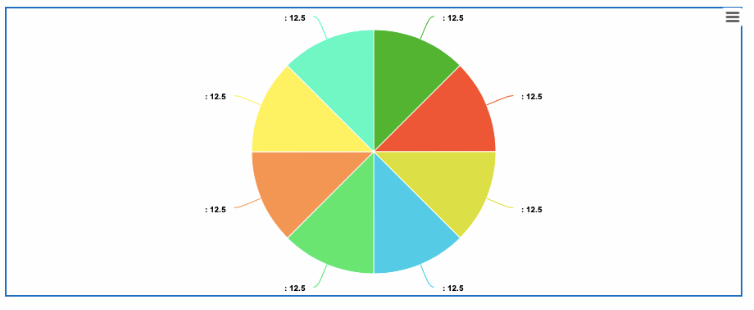
Each piece will represent 12.50% of data.