Refer to our Texas Go Math Grade 7 Answer Key Pdf to score good marks in the exams. Test yourself by practicing the problems from Texas Go Math Grade 7 Lesson 12.1 Answer Key Populations and Samples.
Texas Go Math Grade 7 Lesson 12.1 Answer Key Populations and Samples
Texas Go Math Grade 7 Lesson 12.1 Explore Activity Answer Key
Random and Non-Random Sampling
When information is being gathered about a group, the entire group of objects, individuals, or events is called the population. A sample is part of the population that is chosen to represent the entire group.
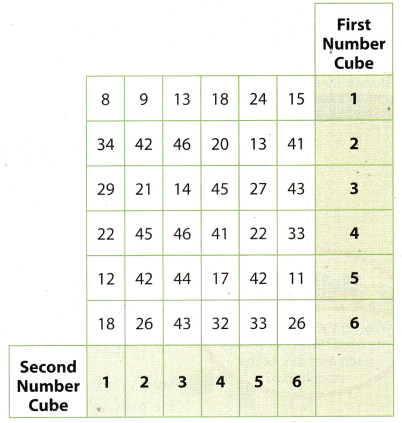
A vegetable garden has 36 tomato plants arranged in a 6-by-6 array. The gardener wants to know the average number of tomatoes on the plants. Each white cell in the table represents a plant. The number in the cell tells how many tomatoes are on that particular plant.
Because counting the number of tomatoes on all of the plants is too time-consuming, the gardener decides to choose plants at random to find the average number of tomatoes on them.
To simulate the random selection, roll two number cubes 10 times. Find the cell in the table identified by the first and second number cubes. Record the number in each randomly selected cell.
A. What is the average number of tomatoes on the 10 plants that were randomly selected?
B. Alternately, the gardener decides to choose the plants in the first row. What is the average number of tomatoes on these plants?
Reflect
Question 1.
How do the averages you got with each sampling method compare to the average for the entire population, which is 28.25?
Answer:
The averages obtained by both sampling methods are around the actual average of 28.5; the first method generated an average of 29.5 while the second method was 20.5.
Question 2.
Why might the first method give a closer average than the second method?
Answer:
The averages obtained by both sampling methods are around the actuaL average of 28.5; the first method generated an average of 29.5 while the second method generated 20.5. The first method’s average is closer to the actual average because it is more distributed and more random unlike the second method.
The first method’s average is closer to the actual average because it is more distributed and more random unlike the second method.
Reflect
Question 3.
You want to know the preferred practice day of all the players in a soccer league. How might you select a random sample?
Answer:
For example, you could surveys one player from each soccer team.
Your Turn
Determine whether each sample is a random or biased sample. Explain your reasoning.
Question 4.
A librarian randomly chooses 100 books from the library’s database to calculate the average length of a library book.
Answer:
This is a random sample because each book, with different length, has an equal chance of being selected.
This is a random sample.
In Madison County, residents were surveyed about a new skateboard park. Determine whether each survey question may be biased. Explain.
A. Would you like to waste the taxpayers’ money to build a frivolous skateboard park?
This question is biased. It discourages residents from saying yes to a new skateboard park by implying it is a waste of money.
B. Do you favor a new skateboard park?
This question is not biased. It does not include an opinion on the skateboard park.
C. Studies have shown that having a safe place to go keeps kids out of trouble. Would you like to invest taxpayers’ money to build a skateboard park?
This question is biased. It leads people to say yes because it mentions having a safe place for kids to go and to stay out of trouble.
Your Turn
Determine whether each question may be biased. Explain.
Question 5.
When it comes to pets, do you prefer cats?
Answer:
Yes, given question will be biased.
Because in given question name of the pet (cats) is already mentioned. So every pets will not have equal chance of being selected. And the answer for the asked question in problem will be mostly in Yes or No.
Yes, given question will be biased
Question 6.
What is your favorite season?
Answer:
No, given question will not be biased.
Because in given question name of any season is not mentioned So every season will, have equal chance of being
selected. And the answer for the asked question in problem will the name of favourite season.
No, given question will not be biased.
Texas Go Math Grade 7 Lesson 12.1 Guided Practice Answer Key
Question 1.
Follow each method described below to collect data to estimate the average shoe size of seventh grade boys. (Explore Activity)
Method 1
A. Randomly select 6 seventh grade boys and ask each his shoe size. Record your results in a table like the one shown.
Answer:
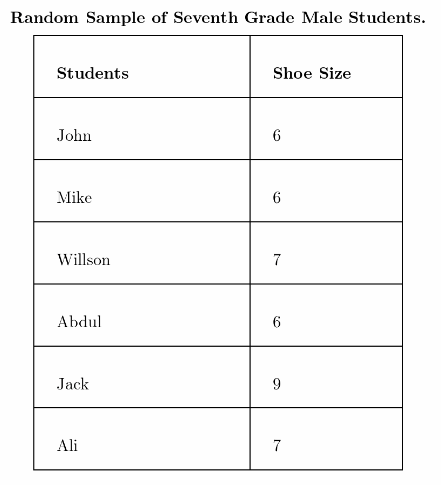
B. Find the mean of this data. Mean:
Answer:
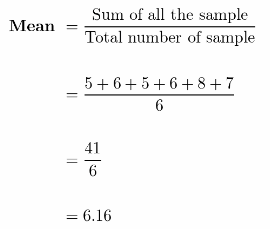
Hence, the mean of shoe size of randomly selected student is 6.16
Method 2
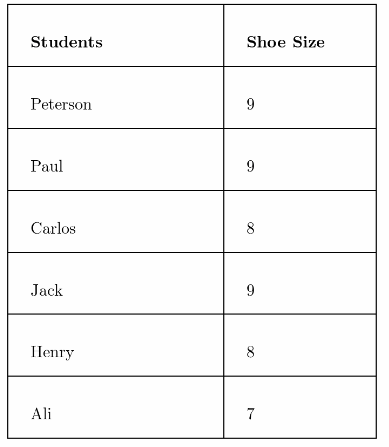
A. Find the 6 boys in your math class with the largest shoes and ask their shoe size. Record your results in a table like the one shown in Method 1.
Answer:
Sample of six boys with largest shoes in my math class are:
B. Find the mean of this data. Mean: ____
Answer:
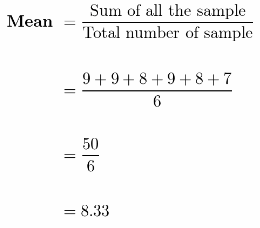
Hence, the mean of shoe size of student is 8.33
Question 2.
Method 1 produces results that are more/less representative of the entire student population because it is a random/biased sample. (Example 1)
Answer:
Method 1 produces results that are more representative of entire students population because it is a random
sample.
Question 3.
Method 2 produces results that are more/less representative of the entire student population because it is a random/biased sample. (Example 1)
Answer:
Method 2 produces results that are less representative of entire students population because it is a biased sample.
Question 4.
Heidi decides to use a random sample to determine her classmates’ favorite color. She asks, “Is green your favorite color?” Is Heidi’s question biased? If so, give an example of an unbiased question that would serve Heidi better. (Example 2)
Answer:
Yes, Heidi’s question is biased.
Because when Heidi is asking question she is particularly mentioning green colour so, here the sample (favourite colour of classmate) is not random. As soon as Heidi mention the green colour in her question the sample becomes the biased sample which means the outcome from her classmates will be in Yes or No.
Example of unbiased question that Heidi can ask from her classmate will be : Which is your favourite color?
Essential Question Check-In
Question 5.
Flow can you select a sample so that the information gained represents the entire population?
Answer:
When the sample are selected randomly from the entire groups or individual (which known as population) then the information gained represents the entire population.
Texas Go Math Grade 7 Lesson 12.1 Independent Practice Answer Key
Question 6.
Paul and his friends average their test grades and find that the average is 95. The teacher announces that the average grade of all of her classes is 83. Why are the averages so different?
Answer:
The average of Paul and his friend (95) is different from the average announced by teacher (83) because when Paul is finding the average he is taking the biased sample. While finding the average Paul is considering only his and friends marks in test But in case of teacher while finding the average, teacher is taking random sample as teacher is considering the marks of each student in class while.
Paul is taking biased sample while teacher is taking random sample
Question 7.
Nancy hears a report that the average price of gasoline is $2.82. She averages the’ prices of stations near her home. She finds the average price of gas to be $3.03. Why are the averages different?
Answer:
There is difference in the average price of gasoline from the report ($2.82) and the gasoline price found by the Nancy ($33.03) because when Nancy is finding the price she is considering the price of gasoline which is near to her home thus taking only biased sample in her calculation. But in case of price of report the calculation are done while taking the sample from everywhere which means the sample are taken randomly.
Nancy is taking biased sample but in case of report sample are taken randomly.
For 8-11, determine whether each sample is a random sample or a biased sample. Explain.
Question 8.
Carol wants to find out the favorite foods of students at her middle school. She asks the boys’ basketball team about their favorite foods.
Answer:
The sample will be biased sample
Because carol wants to know the favourite foods of students at middle school but she asks about it only with the basketball team out of whole middle school. So the population here is only the members of basketball team.
Question 9.
Dallas wants to know what elective subjects the students at his school like best. He surveys students who are leaving band class.
Answer:
The sample will be biased sample
Because Dallas wants to know the elective subjects of students which they liked best but she asks about it only with the students who are leaving band class. So the population here is only the students who are leaving the band class.
Question 10.
Karim wants to know what day of the week students at his school prefer. He randomly asks students each day in the cafeteria.
Answer:
The sample will be random sample
Because Karim wants to know the day of week which students prefer at his school and asks about it with the random students each day in cafeteria. So the population here is all the students of the school.
Question 11.
Members of a polling organization survey 700 registered voters by randomly choosing names from a list of all registered voters.
Answer:
The sample will be random sample
Because members of the potting organisation is surveying 700 registered voters by randomly and choosing the names from the list of registered voters. So the population here is all the 700 registered voters.
Determine whether each question may be biased. Explain.
Question 12.
Joey wants to find out what sport seventh grade girls like most. He asks girls, “Is basketball your favorite sport?”
Answer:
Yes the question asked by Joey is biased.
Because joey while asking from seventh grade girls that which sports do they Like, Joey mentions the name of basketball. So the population will be all the girls who like or not the basketball sports because they will reply in Yes or No. when this question will be asked the girls will not reply about their favourite sports.
Question 13.
Jae wants to find out what type of art her fellow students enjoy most. She asks her classmates, “What is your favorite type of art?”
Answer:
No, the question asked by Jae is not biased.
Because Jae has randomly asked from the fellow students about the art which enjoy the most So the population is all the fellow students of Jae.
Texas Go Math Grade 7 Lesson 12.1 H.O.T. Focus on Higher Order Thinking Answer Key
Question 14.
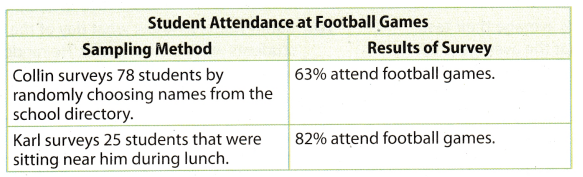
Draw Conclusions Determine which sampling method will better represent the entire population. Justify your answer.
Answer:
The first sampling method in which Collin surveys 78 students randomly will better represent the entire population. The reasons from this are mentioned below :
- In case of Collin surveys are being done on the 78 students as compared to in case case of Karl where survey is done only on 25 students. So larger number of sample will represent entire population the most.
- In case of Collin surveys sample are chosen randomly as compared to Karl’s survey where sample are chosen who are near hint during lunch.
Collin survey will better represent the entire population.
Question 15.
Multistep Barbara surveyed students in her school by looking at an alphabetical list of the 600 student names, dividing them into groups of 10, and randomly choosing one from each group.
a. How many students did she survey? What type of sample is this?
Answer:
Since there are 600 student names and they are divided into 10 groups, the number of students that were surveyed:
600 ÷ 10 = 60
Barbara surveyed 60 students
The sample done is called a random sample. A random sample is giving an equal chance of being selected.
b. Barbara found that 35 of the survey participants had pets. About what percent of the students she surveyed had pets? Is it safe to believe that about the same percent of students in the school have pets? Explain your thinking.
Answer:
The percent of the students that have pets from the 60 participants iS:
\(\frac{35}{60}\) × 100% ≈ 58%
The percent of the students having pets is somewhat reasonable as the basis for the same percentage of students in the school who have pets. This is because of the random sample and the result is a significant percentage of the students which is more than half of the surveyed participants.
Question 16.
Communicating Mathematical Ideas Carlo said a population can have more than one sample associated with it. Do you agree or disagree with his statement? Justify your answer.
Answer:
Basically, a population needs to have one sample. This sample is a part of the population that is chosen to represent the entire group (population). For some, they prefer random sampling, as this gives an equal chance of being selected from the population. However, there is also called a biased sample, in which the sample does not accurately represent the population. So the statement of Carlo really depends on how the sampling will take place and the survey question. For example, the population is a Math Club. The sample could be random or biased depending on the survey question and manner of choosing the sample. For the question, it will be biased when you would ask, what is their favorite subject? It is very obvious that most of the sample will answer Math because the population is from the Math Club. It could be a random sample even when you randomly pick the participant and have a different question not related to being in a Math Club.
It depends on the survey question and population.