Practice questions available in McGraw Hill Math Grade 6 Answer Key PDF Lesson 24.4 Circle Graphs will engage students and is a great way of informal assessment.
McGraw-Hill Math Grade 6 Answer Key Lesson 24.4 Circle Graphs
Exercises
INTERPRET
Question 1.
In the circle graph, which is the smallest department in terms of new hires for the year?
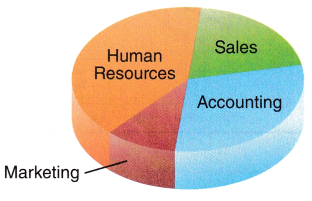
Answer: From the given circle graph we observe that Marketing is the smallest department in terms of new hires for the year.
Question 2.
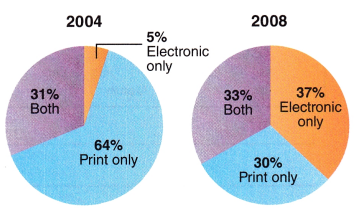
The circle graphs display how people in a company communicated in 2004 and 2008. What information can you gather from the two graphs?
Answer:
From the two graphs, we observed that Electronic has increased from 5% to 37% from 2004 to 2008.
Question 3.
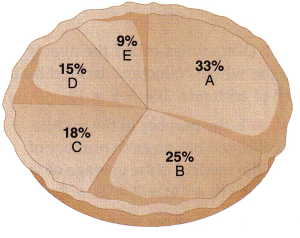
Is the total of items A, E, and B more than C and D?
Answer:
A = 33%
B = 25%
C = 18%
D = 15%
E = 9%
A + E + B = 33 + 9 + 25 =67%
C + D = 18 + 15 = 33%
So, yes the total of items A, E, and B is more than C and D.
Question 4.
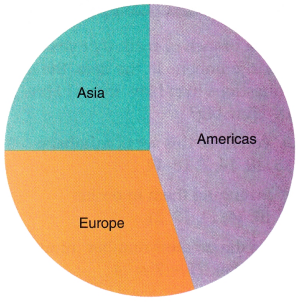
Do the Americas represent more than 50% of the total?
Answer:
No Americans do not represent more than 50% of the total.
Question 5.
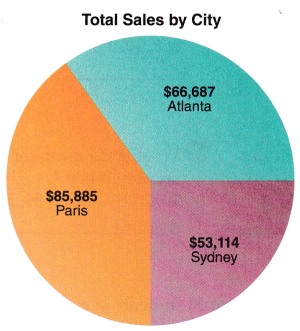
According to the circle graph, are the combined sales for Atlanta and Sydney more than sales for Paris?
Answer:
Sales for Atlanta = $66,687
Sales for Paris = $85,885
Sales for Sydney = $53,114
66687 + 53,114 = $119801
So, the combined sales for Atlanta and Sydney are more than the sales for Paris.
Question 6.
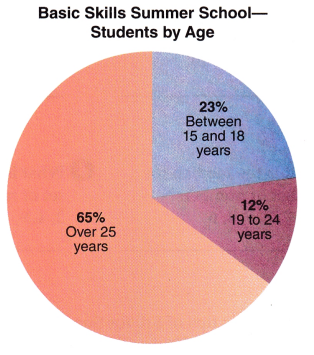
In the circle graph, which age group makes up the majority of students who attend Basic Skills Summer School?
Answer:
Between 15 and 18 years = 23%
Between 19 to 24 years = 12%
Over 25 years = 65%
Over 25 years 65% majority of students who attend Basic Skills Summer School.