Practice questions available in McGraw Hill Math Grade 6 Answer Key PDF Lesson 24.3 Double-Line Graphs will engage students and is a great way of informal assessment.
McGraw-Hill Math Grade 6 Answer Key Lesson 24.3 Double-Line Graphs
Exercises
INTERPRET
Question 1.
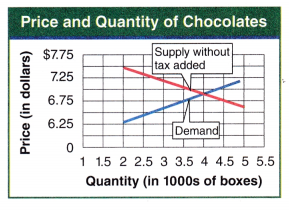
What can you say about the supply and demand of chocolates from the double-line graph?
Answer:
Supply and demand affect the price of all goods sold, even chocolate.
The quantity of chocolates is 4 and price is $6.80
Question 2.
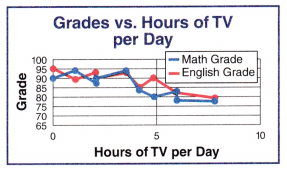
What conclusion can you draw from the double-line graph about grades and how much television is watched?
Answer:
From the above double line graph, we can say that about 95 grades and about 7 hours of TV are watched per day.
Question 3.
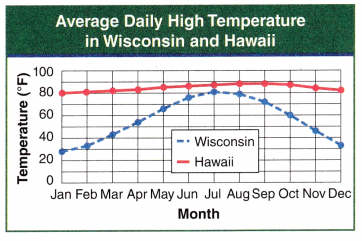
What conclusion can you draw about the temperatures in Hawaii and Wisconsin by looking at the double-line graph?
Answer:
The average daily temperature in Hawaii from Jan to Dec is about 80 degrees.
The average daily temperature in Hawaii is about Jan to Dec is about 30 degrees.
Question 4.
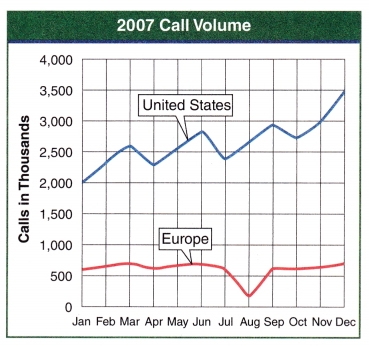
The graph displays the volume (number) of calls for Europe and the United States. What can you conclude about the volume of calls between January to December?
Answer:
From the above graph you conclude about the volume of calls for United States between January to December was 2000 to 3500.
From the above graph you conclude about the volume of calls for Europe between January to December is 600 to 700.
Question 5.
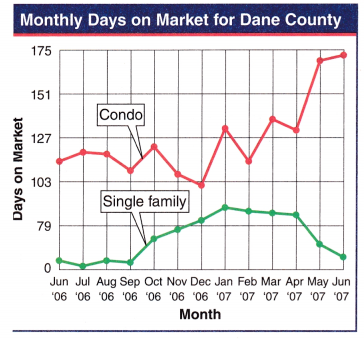
The double-line graph shows the amount of time that a single family house and a condominium stay on the market before they are sold. What conclusion can you make about the relationship?
Answer:
From the above graph, we can see Monthly number of days on market is high on June 07 for Condo and low for single family.
Question 6.
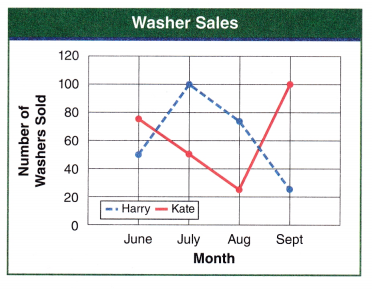
What can you determine about the sales figures for Harry and Kate?
Answer:
The sales figure for Harry is high and the sales figures for Kate are low from June to September.
Question 7.
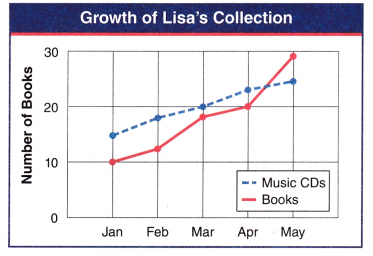
What can you conclude from the double-line graph about Lisa’s Book Collection between January and May?
Answer:
The number of books in Lisa’s Book Collection has been in increased between January and May.