All the solutions provided in McGraw Hill Math Grade 5 Answer Key PDF Chapter 11 Lesson 1 Making a Line Plot are as per the latest syllabus guidelines.
McGraw-Hill Math Grade 5 Answer Key Chapter 11 Lesson 1 Making a Line Plot
Diagram and Interpret
The list of data shows the mass in kilograms of nine cats.
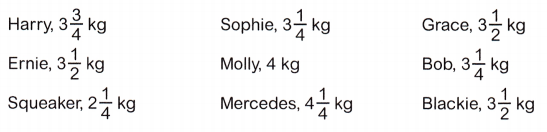
Question 1.
Draw a line plot to show this data set. Use the line plot for exercises 2-5.
Answer:
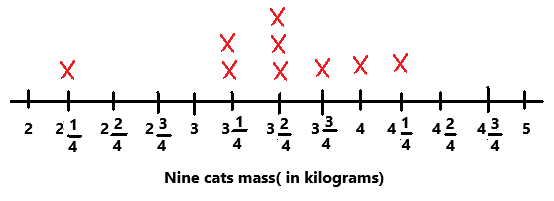
Explanation:
The above line plot is numbered from 2 to 5 with an interval of 1/4.
The given data is marked on the line plot with X on top of it and named the line plot as nine cats mass in kilograms.
Question 2.
Which mass is an outlier?
Answer:
The mass 2 1/4 kg is an outlier.
Question 3.
Draw a rectangle around the cluster. Draw an oval around the gap.
Answer:
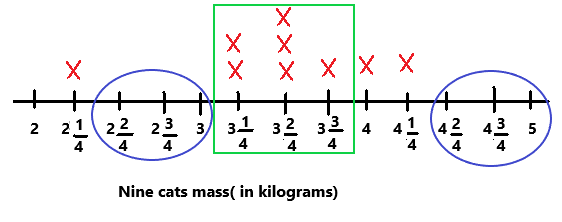
Explanation:
A rectangle is drawn around the cluster which is 3 1/4 kg to 3 3/4 kg.
A oval should be drawn around the gap. In the line plot we can observe two gaps so, two ovals should be drawn. One oval is drawn around 2 2/4 kg to 3 kg and second oval is drawn around 4 2/4 kg to 5 kg.
Question 4.
How many cats have a mass of 3\(\frac{1}{4}\) kg?
Answer:
Two cats have a mass of 3\(\frac{1}{4}\) kg.
Question 5.
What is the most common mass in the data set?
Answer:
The most common mass in the data set is 3\(\frac{1}{2}\) kg