Practice the questions of McGraw Hill Math Grade 8 Answer Key PDF Lesson 14.5 Graphing Relationships to secure good marks & knowledge in the exams.
McGraw-Hill Math Grade 8 Answer Key Lesson 14.5 Graphing Relationships
Exercises
Noah and Kim are making blue frosting for cupcakes. Kim adds 6 drops of blue food coloring to 1 cup of frosting and stirs until it is completely mixed. Noah adds 12 drops of blue food coloring to 2 cups of frosting and stirs until it is completely mixed. When they compare their two bowls, Noah is surprised to see that both frostings are the same shade of blue; he had expected his to be darker since he used more blue food coloring.
Question 1.
Explain why the two bowls of frosting are the same shade of blue.
Answer:
Both mixed same amount of quantity,
Explanation:
Given Noah and Kim are making blue frosting for cupcakes.
Kim adds 6 drops of blue food coloring to 1 cup of frosting and
stirs until it is completely mixed. Noah adds 12 drops of blue
food coloring to 2 cups of frosting and stirs until it is completely mixed.
When they compare their two bowls, Noah is surprised to see
that both frostings are the same shade of blue; he had expected
his to be darker since he used more blue food coloring.
But the two bowls of frosting are the same shade of blue because
both added 6 drops only to each cup.
Question 2.
What is the ratio (unit rate) of drops of food coloring to cups of frosting?
Answer:
6:1,
Explanation:
The ratio (unit rate) of drops of food coloring to cups of frosting as
it is 6 drops to 1 cup each it is 6:1.
Question 3.
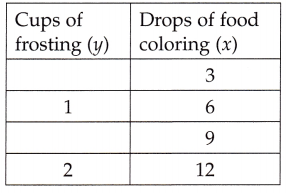
Fill in the rest of the function table below for that ratio.
Answer:
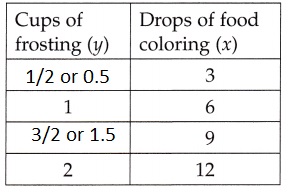
Explanation:
Filled in the rest of the function table above for that ratio as shown above.
Question 4.
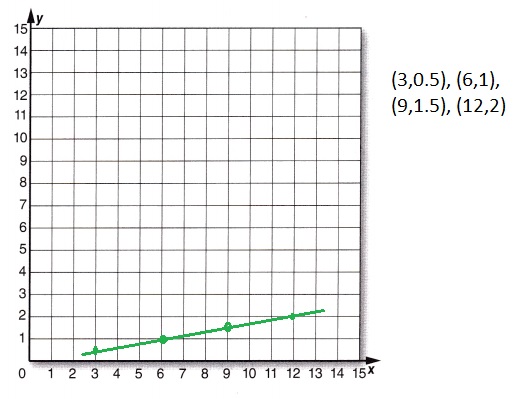
Plot the ordered pairs from the function table on the grid.
Answer:
Explanation:
Plotted the ordered pairs from the function table as (3,0.5),
(6,1), (9,1.5), (12,2) on the grid as shown above.
Question 5.
What is the slope of the line created?
Answer:
slope is \(\frac{1}{6}\),
Explanation:
A slope of a line is the change in y coordinate with respect to
the change in x coordinate The equation of the line is
written in the slope-intercept form, which is: y = mx + b,
where m represents the slope and b represents the y-intercept.
Therefore the given line y = x/6 has slope \(\frac{1}{6}\).
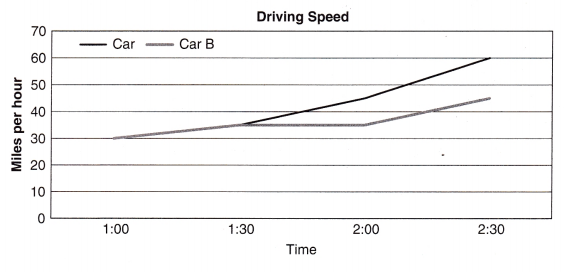
The chart below shows the speed of two cars in miles per hour.
Question 6.
Which car increased in speed more between 1:30 and 2:00? How do you know?
Answer:
Car A,
Explanation:
If we see speed of the cars between 1:30 and 2:00, Car A increased
from 35 miles to 45 miles and Car B is at constant speed of 35 miles only,
therefore Car A has increased the speed.
Question 7.
At what time do the cars begin to go different speeds?
Answer:
From 2:00 to 2:30,
Explanation:
From 2:00 to 2:30 Car A went with speed of 45 miles to
60 miles and Car B at speed of 35 miles to 45 miles,
So from 2:00 to 2:30 the cars begin to go different speeds.
Question 8.
Which car is going faster at 2:30?
Answer:
Car A,
Explanation:
At 2:30 Car A is at speed of 45 miles to 60 miles and
Car B at speed of 35 miles to 45 miles,
So if compare 45 miles > 35 miles therefore Car A is going faster.
Question 9.
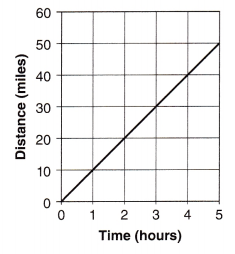
Find the unit rate for the graph below.
Answer:
Unit rate is 10,
Explanation:
The unit rate, in the point represents the amount of vertical increase for every horizontal increase of unit on the graph.
Now if we see the given graph it has unit rate of 10/1 = 10, 20/2 = 10,
30/3 = 10, 40/4 = 10 and 50/5 = 10, It is constant 10.
Question 10.
Sketch a graph of a linear function that is negative and decreasing.
Answer:
Explanation:
If the graph goes down as it moves from left to right, then the graph depicts a decreasing function.
This is comparable to the side of a hill that is going downwards.
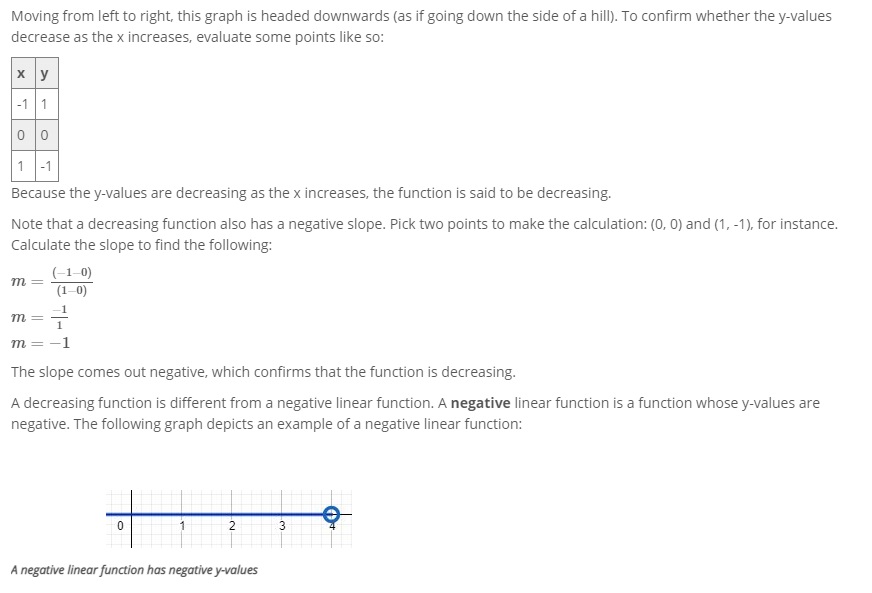
At x = 0, y = -3, if x = 1 , y = -2 even though the graph is
going up it is still a negative linear function because its
y values are negative.
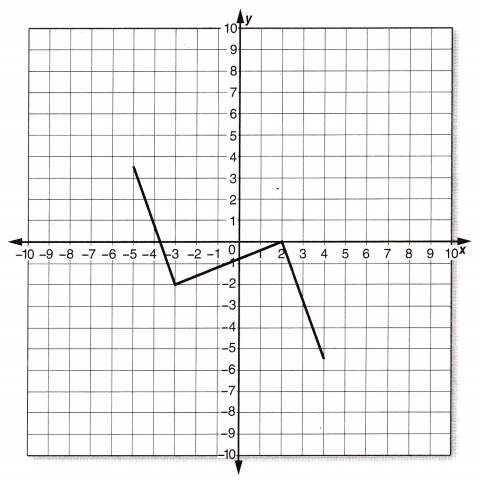
Question 11.
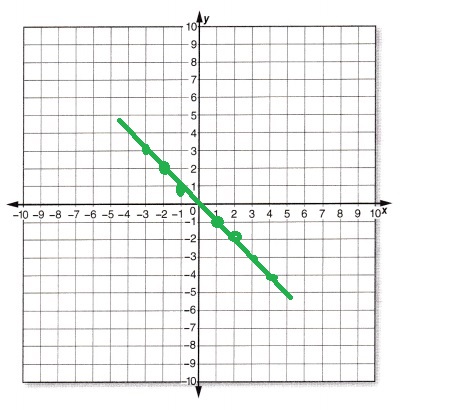
Is the function above increasing or decreasing?
Answer:
Decreasing,
Explanation:
The slope comes out negative which confirms that the function is decreasing.
Question 12.
Is this function linear or nonlinear?
Answer:
Nonlinear,
Explanation:
The function is non linear as it is not a line.
Nonlinear Function – A function whose graph is not a line or part of a line.