Refer to our Texas Go Math Grade 8 Answer Key Pdf to score good marks in the exams. Test yourself by practicing the problems from Texas Go Math Grade 8 Unit 6 Study Guide Review Answer Key.
Texas Go Math Grade 8 Unit 6 Study Guide Review Answer Key
Texas Go Math Grade 8 Unit 6 Exercises Answer Key
Module 14 Scatter Plots
Question 1.
The table shows the income of 8 households, in thousands of dollars, and the number of televisions in each household. (Lesson 14.1)
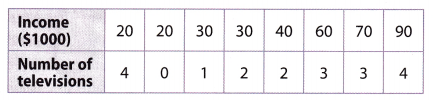
a. Make a scatter plot of the data.
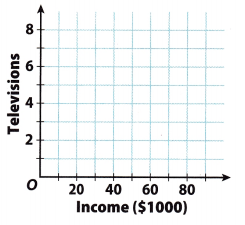
Answer:
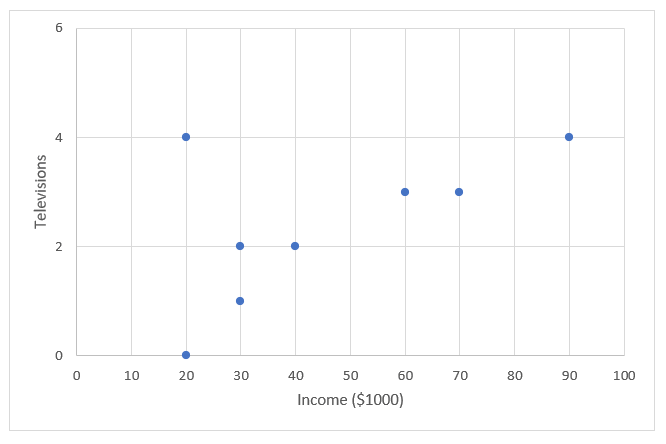
b. Describe the association between income and number of televisions. Are any of the values outliers?
Answer:
Data show a positive association because data sets increase together. In different words, we may say that with greater income, the number of television in households increases.
Data that show a positive association lie basicaLly along with a line exhibiting a linear association.
One value is very different from the rest of the data in the set and that value represents an outlier. OutLier is point (20, 4).
Question 2.
The scatter plot shows the relationship between the price of a product and the number of potential buyers. (Lesson 14.2)
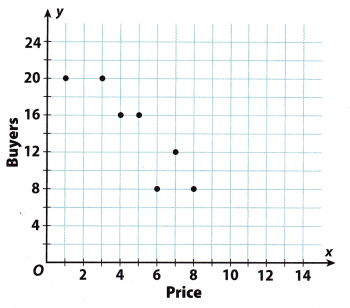
a. Draw a trend line for the scatter plot.
Answer:
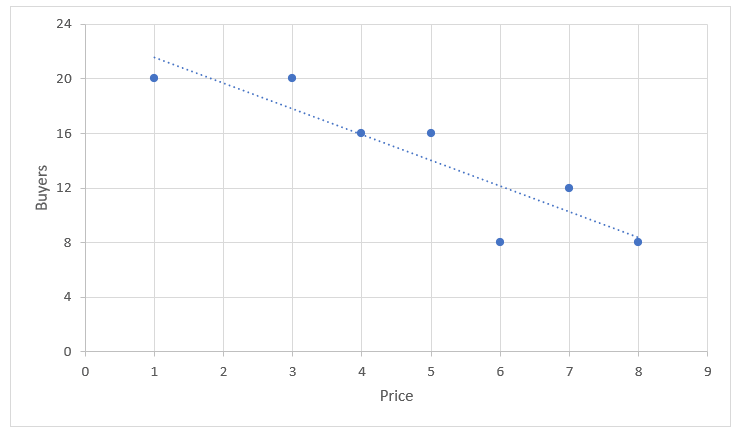
b. Write an equation for your trend line.
Answer:
The trend line passes through points (4, 16) and (8, 8).
Slope formula: m = \(\frac{y_{2}-y_{1}}{x_{2}-x_{1}}\)
m = \(\frac{8-16}{8-4}\)
m = \(\frac{-8}{4}\)
m = 2
Find the y-intercept of the trend line.
Slope-intercept form: y = mx + b
16 = -2(4) + b
b = 24
Use slope and y-intercept values to write the equation.
y = -2x + 24
c. When the price of the product is $3.50, the number of potential buyers will be about ___________.
Answer:
Use the equation for trend line:
y = -2x + 21
y = -2(3.50) + 24
y = -7 + 24
y = 17
When the price of the product is $3.50, the number of potential buyers will be about 17.
d. When the price of the product is $5.50, the number of potential buyers will be about _______.
Answer:
y = -2x + 24
y = -2(5.50) + 21
y = -11 + 24
y = 13
Then the price of the product is $5.50, the number of potential buyers will be about 13.
Module 15 Sampling
Question 1.
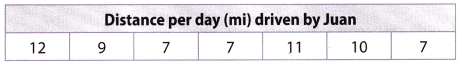
Find the mean and mean absolute deviation of the set of data. Round to the nearest hundredth. (Lesson 15.1)
Mean: ____________
Mean absolute deviation: _________
Answer:
Mean: 9
Mean absolute deviation: 1.7
Explanation:
Given data,
12, 9, 7, 7, 11, 10, 7
Step 1 is to find the mean of the data
Mean = (12+9+7+7+11+10+7)/7 = 9
Step 2 to find the difference between each data and mean
The difference between 12 and 9 is 3
The difference between 9 and 9 is 0
The difference between 7 and 9 is 2
The difference between 7 and 9 is 2
The difference between 11 and 9 is 2
The difference between 10 and 9 is 1
The difference between 7 and 9 is 2
Now add all the differences
3 + 0 + 2 + 2 + 2 + 1 + 2 = 12
Now divide it by the number of data
12/7 = 1.7
Therefore mean absolute deviation of the set of data is 1.7
Question 2.
A pottery store gets a shipment of 1500 dishes and wants to estimate how many dishes are broken. The manager will use a random sample to represent the entire shipment. In actuality, 18% of the dishes are broken. (Lesson 15.2)
You will simulate the manager’s test by generating random numbers between 1 and 1500. Explain what the generated numbers will mean.
Use the graphing calculator function randlnt(1, 1500) to generate 30 numbers.
According to the sample, how many broken dishes should the manager expect to find in the shipment?
Answer:
Texas Go Math Grade 8 Unit 6 Performance Tasks Answer Key
Question 1.
CAREERS IN MATH Psychologist A psychologist gave a test to 15 women of different ages to measure their short-term memory. The test score scale goes from 0 to 24, and a higher score means that the participant has a better short-term memory. The scatter plot shows the results of this study.
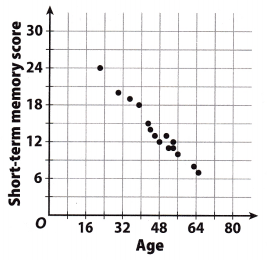
a. Describe the pattern in the data. Is there a positive or negative association?
Answer:
The pattern in the data shows a negative correlation. That means that as one data set increases, the other decreases.
For example, when persons age increases, short- term memory score decrease. In process of becoming older, people have worse short-term memory.
b. Draw a line of best fit on the scatter plot and estimate its slope, interpret the slope in the context of the problem.
Answer:
This scatter plot shows the negative association and lie along a line exhibit a linear association.
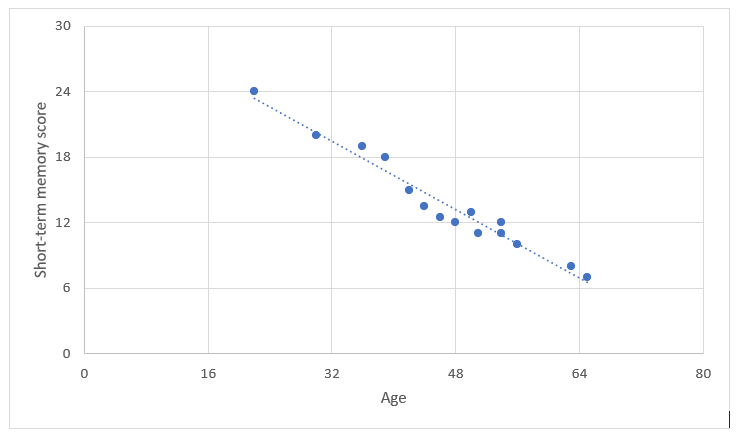
c. In another test, a 70-year-old woman scored 8. Does your line of best fit predict a higher or lower score? What may have happened?
Answer:
Line of best fit predict a lower score.
Trend line will move a little higher. Also, that point might become a outlier because it will be different and much further than others at line.
Question 2.
Tara and Makina are friends and study partners who decide to compare their math test scores for the semester.
Tara’s grades: 80, 95, 85, 70, 90
Makina’s grades: 75, 90, 95, 75, 100
a. Find the mean of each girl’s test scores. Show your work.
Answer:
Tara’s grades: 80, 95, 85, 70, 90
There are 5 observations
We know that,
Mean = sum of observations/number of observations
Mean = (80 + 95 + 85 + 70 + 90)/5
Mean = 84
Makina’s grades: 75, 90, 95, 75, 100
There are 5 observations
We know that,
Mean = sum of observations/number of observations
Mean = (75 + 90 + 95 + 75 + 100)/5 = 87
b. Find the mean absolute deviation (MAD) for each girl. Show your work.
Answer:
Mean of Tara’s grades is 84.
Find the difference between each data and mean:
The difference between 80 and 84 is 4
The difference between 95 and 84 is 11
The difference between 85 and 84 is 1
The difference between 70 and 84 is 14
The difference between 90 and 84 is 6
Add all the difference:
4 + 11 + 1 + 14 + 6 = 36
MAD = 36/5 = 7.2
So, the MAD of Tara’s grade is 7.2
Mean of Makina’s grades is 87.
Find the difference between each data and mean:
The difference between 75 and 87 is 12
The difference between 90 and 87 is 3
The difference between 95 and 87 is 8
The difference between 75 and 87 is 12
The difference between 100 and 87 is 13
Sum of all the differences
12 + 3 + 8 + 12 + 13 = 48
Now divide it by the number of data
48/5 = 9.6
Thus the mean absolute deviation is 9.6
c. Who has the better test scores? Who is more consistent? Explain.
Answer:
By comparing both the Mean and MAD we can say that Makina has the better test scores.
Texas Go Math Grade 8 Unit 6 Mixed Review Texas Test Prep Answer Key
Selected Response
Use the data set below for 1-2.
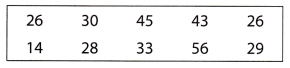
Question 1.
What ¡s the mean of the data set?
(A) 14
(B) 26
(C) 33
(D) 42
Answer: (C) 33
Explanation:
Given data.
26, 30, 45, 43, 26, 14, 28, 33, 56, 29
We know that,
Mean = sum of observations/number of observations
Mean = (26+30+45+43+26+14+28+33+56+29)/10 = 33
Option C is the correct answer.
Question 2.
What is the mean absolute deviation?
(A) 2
(B) 4
(C) 6
(D) 9
Answer:(D) 9
Explanation:
Mean = sum of observations/number of observations
Mean = (26+30+45+43+26+14+28+33+56+29)/10 = 33
Find the difference between each data and mean:
The difference between 26 and 33 is 7
The difference between 30 and 33 is 3
The difference between 45 and 33 is 12
The difference between 43 and 33 is 10
The difference between 26 and 33 is 7
The difference between 14 and 33 is 19
The difference between 28 and 33 is 5
The difference between 33 and 33 is 0
The difference between 56 and 33 is 23
The difference between 29 and 33 is 4
Add all the differences:7+3+12+10+7+19+5+0+23+4 = 90
MAD = 90/10 = 9
Thus MAD = 9
Option D is the correct answer.
Question 3.
What type of association is there between the speed of a car and the distance the car travels in a given time at that speed?
(A) cluster
(B) negative association
(C) no association
(D) positive association
Answer:
(D) positive association
Explanation:
As the speed of a car increases, the distance the car travels increases. This is an example of positive association.
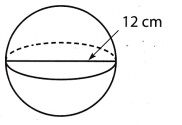
Question 4.
Using 3.14 for π, what is the volume of the sphere to the nearest tenth?
(A) 508.7 cubic centimeters
(B) 678.2 cubic centimeters
(C) 904.3 cubic centimeters
(D) 2713 cubic centimeters
Answer:
(C) 904.3 cubic centimeters
Explanation:
Diameter of a sphere = 12 cm
Radius = \(\frac{12}{2}\) = 6 cm
Volume of the sphere = \(\frac{4}{3}\)πr3
VoLume = \(\frac{4}{3}\) × 3.14 × 63
Volume = \(\frac{4}{3}\) × 3.14 × 216
Volume = 904.32 cm3
Volume ≈ 904.3 cm3
Hot Tip! Read graphs and diagrams carefully. Look at the labels for important information.
Question 5.
Which scatter plot could have a trend line given by the equation y = -7x + 90?
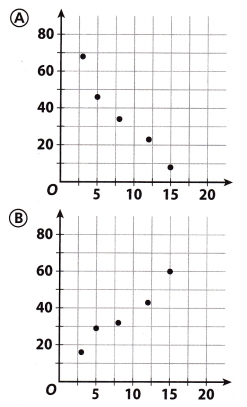
Answer: Option A is the correct answer
Question 6.
For which situation could flipping a coin not be used as a simulation to generate a random sample?
(A) to predict the number of wins a team will have in a season
(B) to predict whether the number of times the number rolled on a standard number cube will be even or odd
(C) to predict the number of people who will attend an event
(D) to predict the number of boys or girls born at a hospital in a month
Answer: (D) to predict the number of boys or girls born at a hospital in a month
Question 7.
The vertices of a triangle are (11, 9), (7, 4), and (1, 11). What are the vertices after the triangle has been reflected over the y-axis?
(A) (9, 11), (4, 7), (11, 1)
(B) (11, -9), (7, -4), (1, -11)
(C) (9, 11), (4, 7), (11, 1)
(D) (-11, 9), (-7, 4), (-1, 11)
Answer:
(D) (-11, 9), (-7, 4), (-1, 11)
Explanation:
(11, 9),(7, 4) and (1, 11) are the vertices of a triangle.
We need to use the rule to reflect the triangle across the y-axis. The rule said that we need to change the sign of the x-coordinate.
Coordinates:
(11, 9)
(7, 4)
(1, 11)
RefLect across the y-axis (-x, y):
(- 11, 9)
(-7, 4)
(-1, 11)
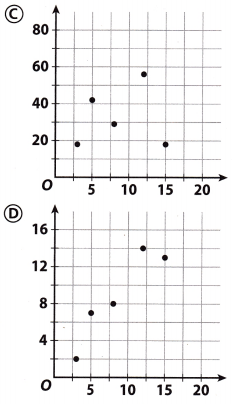
Question 8.
Which of the following is not shown on the scatter plot below?
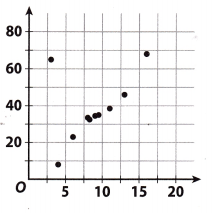
(A) cluster
(B) negative association
(C) outlier
(D) positive association
Answer:
(B) negative association
Explanation:
Cluster is shown on the scatter plot around point (8, 34).
Negative association is not shown on the scatter plot because a trend line is increasing.
Outlier is shown on the scatter plot at point (3. 65).
Positive association is shown on the scatter plot because the trend line is increasing.
Gridded Response
Question 9.
A random sample of 45 students was asked to pick their favorite type of shoe, and 18 of them answered sandals. There are 390 students in the school. How many are likely to pick sandals as their favorite type of shoe?
Answer:
Given,
A random sample of 45 students was asked to pick their favorite type of shoe, and 18 of them answered sandals. There are 390 students in the school.
18/45 = 0.4
390 × 0.4 = 156
Thus 156 students are likely to pick sandals as their favorite type of shoe.
Hot Tip! Estimate your answer before solving the question. Use your estimate to check the reasonableness of your answer.
Question 10.
Bert took a handful of buttons from a bag. Out of the 27 buttons in his hand, 12 were brown. How many brown buttons should Bert expect to find in the bag if there are a total of 180 buttons?
Answer:
Given,
Bert took a handful of buttons from a bag. Out of the 27 buttons in his hand, 12 were brown.
12/27 = 0.4
Bert expect to find in the bag if there are a total of 180 buttons
That means 180 × 0.4 = 72
Thus there would be 72 buttons if there are 180 buttons.