Refer to our Texas Go Math Grade 8 Answer Key Pdf to score good marks in the exams. Test yourself by practicing the problems from Texas Go Math Grade 8 Module 14 Quiz Answer Key.
Texas Go Math Grade 8 Module 14 Quiz Answer Key
Texas Go Math Grade 8 Module 14 Ready to Go On? Answer Key
14.1 Scatter Plots arid Association
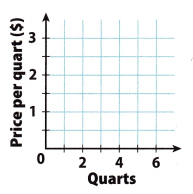
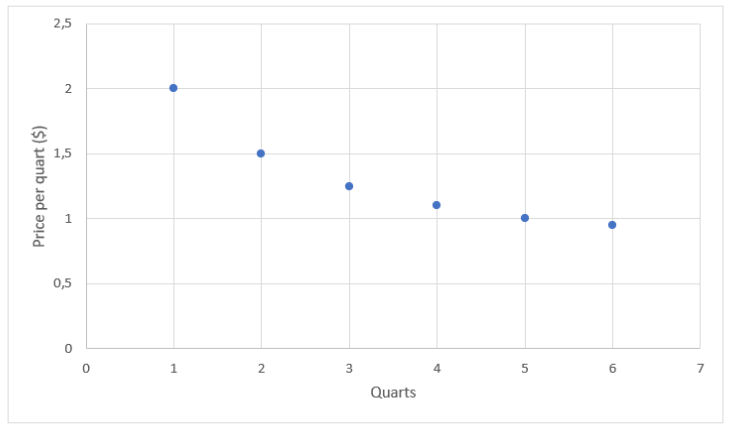
An auto store is having a sale on motor oil. The chart shows the price per quart as the number of quarts purchased increases. Use the data for 1-2.

Question 1.
Use the given data to make a scatter plot.
Answer:
Plot the points: (1, 2), (2, 1.50), (3. 1.25), (4, 1.10), (5, 1), (6, 0.95)
Question 2.
Describe the association you see between the number of quarts purchased and the price per quart. Explain.
Answer:
The association seen between the number of quarts purchased and the price per quart is negative and nonlinear. As the number of quarts rises, the price per quart decreases but there is a data curve.
14.2 Trend Lines and Predictions
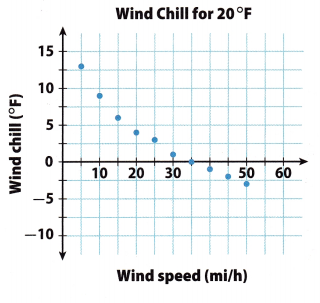
The scatter plot below shows data comparing wind speed and wind chill for an air temperature of 20 °F. Use the scatter plot for 3-5.
Question 3.
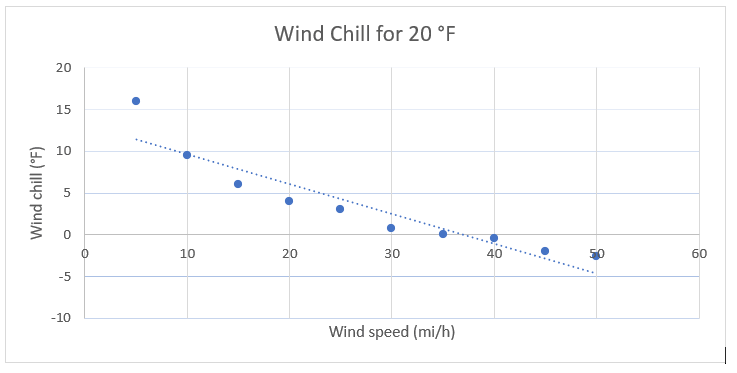
Draw a trend line for the scatter plot.
Answer:
Draw a trend line for the scatter plot.
Question 4.
Write an equation for your trend line.
Answer:
Find the slope of the trend line The line passes through points (10, 8.75) and (35, 0).
Use the slope formula: m = \(\frac{y_{2}-y_{1}}{x_{2}-x_{1}}\)
m = \(\frac{0-8.75}{35-10}\)
m = \(\frac{-8.75}{25}\)
m = -0.35
Find the y-intercept of the trend line.
Slope-intercept form : y = mx + b
0 = -0.35.0 + b
0 = -12.25 + b
b = 12.25
Use your slope and y-intercept values to write the equation.
y = mx + b
y = -0.35x + 12.25
The equation for the trend line is y = -0.35x + 12.25
Question 5.
Use your equation to predict the wind chill to the nearest degree for a wind speed of 60 mi/h.
Answer:
Use the equation for the trend line.
y = mx+b
y = -0.35(60) + 12.25
y = -21 + 12.25
y = -8.75
y ≈ -9
The wind chill to the nearest degree for a wind speed of 60 mi/h is 9°F.
Essential Question
Question 6.
How can you use scatter plots to solve real-world problems?
Answer:
Using a scatter plot, you can see positive and negative trends such as prices over time. You can also make predictions such as height at a certain age.
Texas Go Math Grade 8 Module 14 Mixed Review Texas Test Prep Answer Key
Selected Response
Question 1.
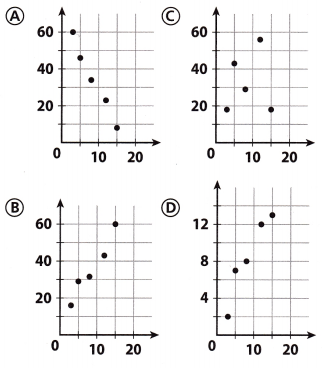
Which scatter plot could have a trend line whose equation is y = 3x + 10?
Answer:
(C)
Explanation:
Equation for the trend Line is y = 3x + 10
y = mx + b
The slope of the trend line is m = 3.
The slope is positive, m > 0, which means that a trend line is increasing.
If the line is increasing, options A and C are not solutions because in these options trend line decreasing.
The y-intercept of the trend line is b = 10.
That is the y-coordinate where the line intersects the y-axis.
(0, 10) where the trend line intersects the y-axis is in scatter plot in option B.
Question 2.
What type of association would you expect between a person’s age and hair length?
(A) linear
(B) negative
(C) none
(D) positive
Answer:
(B) negative
Explanation:
The length of their hair reduces. This is because the length of hair changes with the growth phase of the hair follicles. When one is young, the cells of the papilla divide more rapidly, and hence the length of the hair to be long before reaching the transitional phase and then shed off in the telogen phase. The older one gets, the papilla cells do not divide as rapidly and the length of the hair shortens with age.
The older persons tended to have shorter hair.
Question 3.
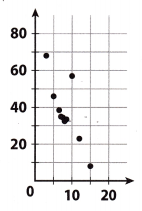
Which is not shown on the scatter plot?
(A) cluster
(B) negative association
(C) outlier
(D) positive association
Answer:
(D) positive association
Explanation:
Cluster, negative association and outlier are shown on the scatter plot.
Cluster is visible between points (12, 21) and (5, 43).
Outlier is visible at point (10, 59)
If we draw the trend line, line would decrease. Because of that, on the scatter plot is shown negative association.
If the trend line decrease, on the scatter plot is not shown positive association.
Question 4.
A restaurant claims to have served 352,000,000 hamburgers. What is this number in scientific notation?
(A) 3.52 × 10⁶
(B) 3.52 × 10⁸
(C) 35.2 × 10⁷
(D) 352 × 106
Answer:
(B) 3.52 × 10⁸
Explanation:
100,000,000 is 108
352,000,000 = 352 × 106 = 3.52 × 10⁸
Question 5.
Which equation describes the relationship between x and yin the table?

(A) y = -4x
(B) y = \(\frac{-1}{4}\)x
(C) y = 4x
(D) y = \(\frac{1}{4}\)x
Answer:
(B) y = \(\frac{-1}{4}\)x
Explanation:
In order to find out the relationship between x and y, we have use the values in the question and substitute them into the solution options.
So, we will use point (- 8, 2) and substitute x with -8 and y with 2 in every option.
(a)
y = -4x
2 = -4(-8)
2 = 32
False
(b)
y = \(\frac{-1}{4}\)x
2 = \(\frac{-1}{4}\) (-8)
2 = 2
True
(c)
y = 4x
2 = 4(-8)
2 = -32
False
(d)
y = \(\frac{1}{4}\)x
2 = \(\frac{1}{4}\)(-8)
2 = -2
False
Gridded Response
Question 6.
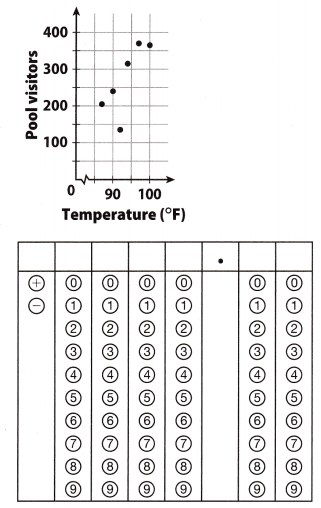
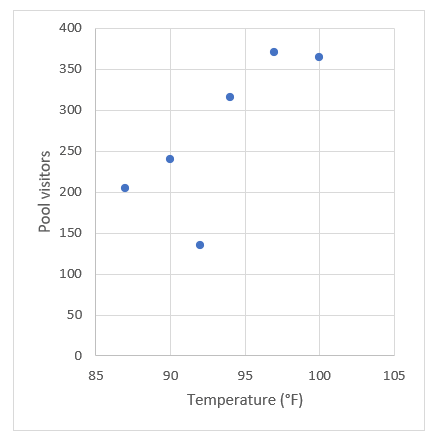
Predict the number of visitors when the temperature is 102°F.
Answer:
a)
b)
An outlier is point (92, 135).
c)
Based on the number of visitors on a day with the temperature of 100° F, I would expect that on a day with a temperature of 102°, the pool would have between 350 and 400 visitors.