Refer to our Texas Go Math Grade 7 Answer Key Pdf to score good marks in the exams. Test yourself by practicing the problems from Texas Go Math Grade 7 Lesson 7.2 Answer Key Writing and Graphing Equations in the Form y = mx + b.
Texas Go Math Grade 7 Lesson 7.2 Answer Key Writing and Graphing Equations in the Form y = mx + b
Texas Go Math Grade 7 Lesson 7.2 Explore Activity Answer Key
Graphing Linear Relationships
Teresa signs up for a membership to rent video games. The company charges $5 per month and $2 per video game. Graph a linear relationship between the number of games Teresa rents and her monthly cost.

STEP 1: Make a table. Record different values for the linear relationship.
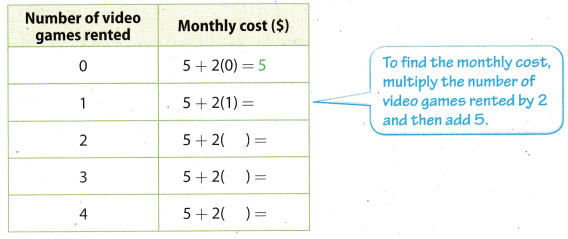
STEP 2: Use the table to create ordered pairs:
(0, 5), (1, 7), (2, 9), (3, 11), (4, 13)
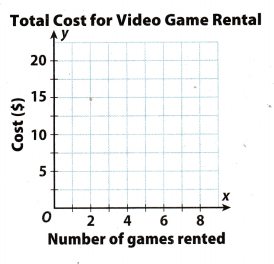
Plot each ordered pair on the coordinate grid.
Reflect
Question 1.
Do the values between the points make sense in this context? Explain.
Answer:
This makes sense because the graphics show that when the number of lending increases, the price is rising.
Your Turn
Write an equation to describe the linear relationship.
Question 2.
The temperature of a pot of water is 45°F. The temperature increases by 20°F per minute when being heated.
Answer:

y = 20 ∙ x + 45
Question 3.
A bamboo reed is planted when it is 12 centimeters tall. It grows 2.2 centimeters per week.
Answer:
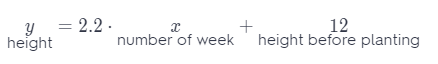
y = 22 ∙ x + 12
Example 2
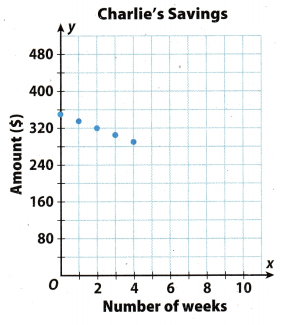
Charlie starts with $350 in his savings account. He withdraws $15 per week from his account. Represent the relationship using a table, an equation, and a graph.
STEP 1: Make a table. Record different values for the linear relationship.
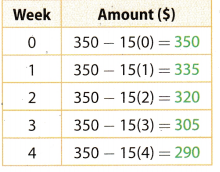
STEP 2: Write an equation for the amount of money y in the savings after x weeks. $350 minus $15 times the number of weeks
y = 350 – 15x
STEP 3: Use the table to create ordered pairs and then plot the data.
Reflect
Question 4.
Does it make sense to connect the points on the graph with a line? Explain.
Answer:
It makes sense, because in this way it is easier to see that when withdrawing money, the saved amount is reduced.
Question 5.
Does an ordered pair with a negative y-value make sense in the situation?
Answer:
It makes no sense to take negative values for y because it would mean that he takes more money than what he has on the account, which is impossible.
Your Turn
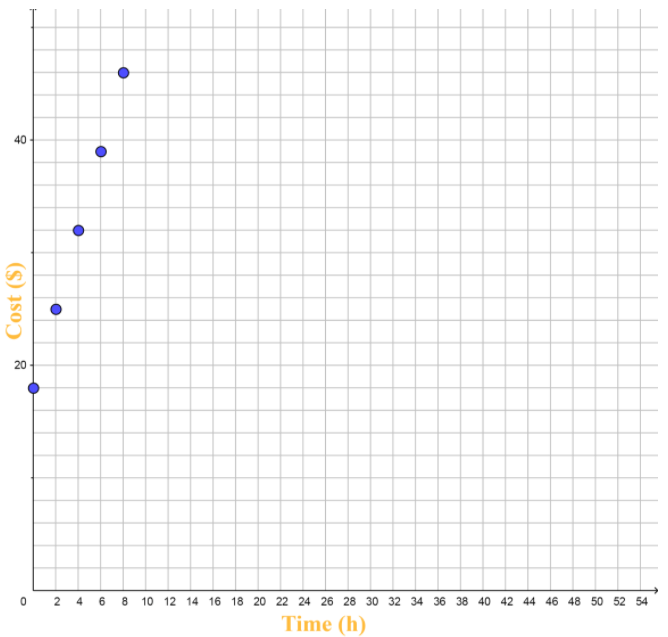
Question 6.
A bicycle rental company charges $18 to rent a bicycle, plus $7 for every two hours of rental time. Represent the relationship using a table, an equation, and a graph.
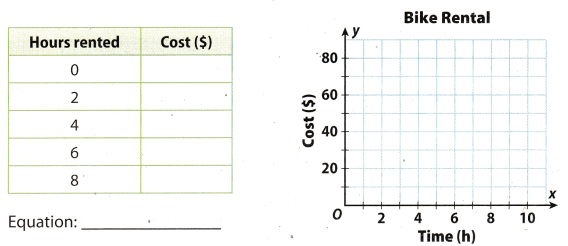
Answer:
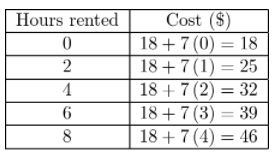
Equation: 18 + 7 ∙ x = y
Texas Go Math Grade 7 Lesson 7.2 Guided Practice Answer Key
Graph the linear relationship. (Explore Activity)
Question 1.
A pool contains 5 liters of water, and 10 liters of water are being poured into the pool every 5 minutes.
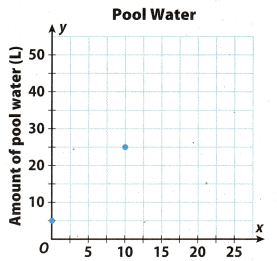
Answer:
y = 2 ∙ x + 5
Ploted pairs on the coordinate grid are:
A = (0, 5)
More precisely in equation replace x with 0, and y with 5 for point A;
B = (10, 25)
Replace in equation x with 10, and y with 25 for point B.
Write an equation to describe the linear relationships. (Example 1)
Question 2.
A moving company charges a $50 flat fee and $55 per hour to move.
y = _______ x + _______
Answer:
y = 55 ∙ x + 50
Question 3.
Anne has $250 in a savings account. She withdraws $5 per month.
y = _______ x + _______
Answer:
y = -5 ∙ x + 250
Question 4.
Erin owns $375 worth of comic books. She spends $15 every week on new comic books. Represent the relationship using a table and an equation. (Example 2)
y = _______x + _______
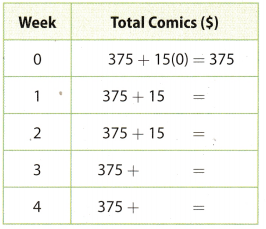
Answer:
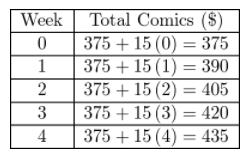
y = 15 ∙ x + 375
Essential Question Check-In
Question 5.
How can you use a table of data to write and graph a linear relationship?
Answer:
All the initial values that we get actually represent x, while all the values obtained based on the initial conditions by solving the equation represent y.
Texas Go Math Grade 7 Lesson 7.2 Independent Practice Answer Key
A cab company charges a $3.50 boarding fee and $0.50 per mile.
Question 6.
Write an equation to describe the relationship between the cost of the cab ride and the number of miles traveled.
Answer:
y = 0.5 ∙ x + 3.5
Question 7.
Graph the linear relationship.
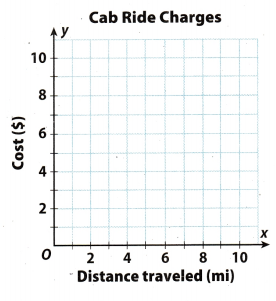
Answer:
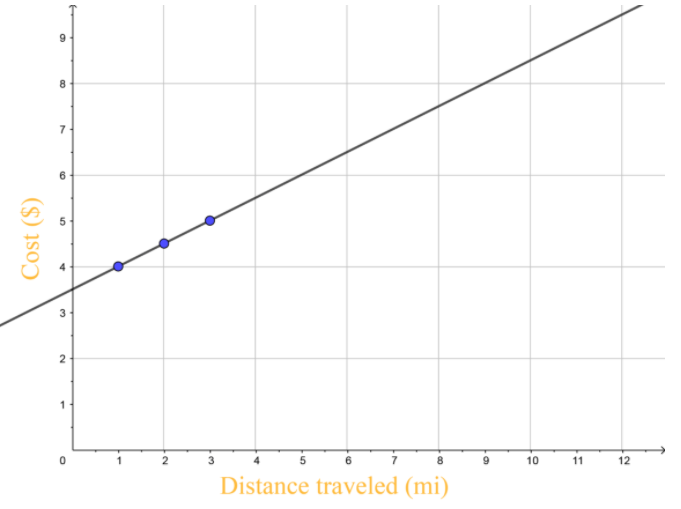
y = 0.5 ∙ x + 3.5
Question 8.
Draw Conclusions Does it make sense to draw a line through the points? Explain.
Answer:
It makes sense because in this way we easily notice how the billing increases in the miles ahead.
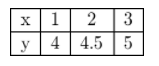
Question 9.
What If? Suppose that the boarding fee was changed to $5. How would the graph change?
Answer:
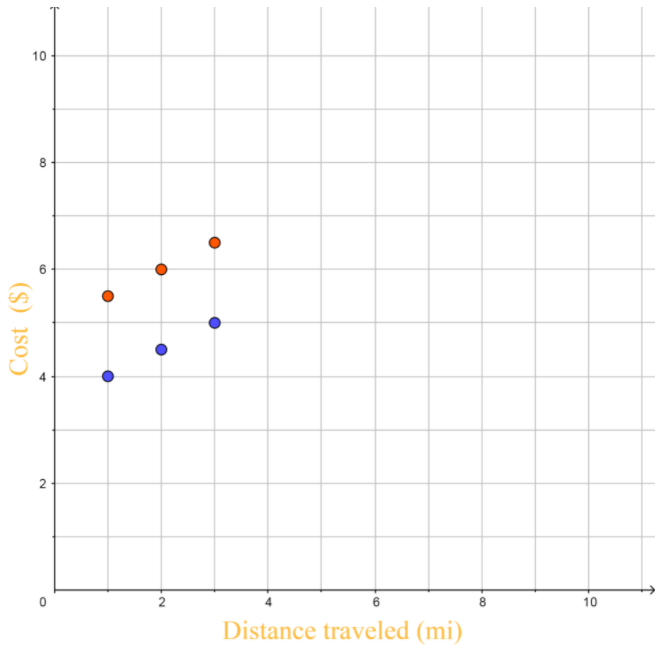
y1 = 0.5 ∙ x + 3.5
y2 = 0.5 ∙ x + 5
The value of the variable y1 has increased
(with that increase we got a variable y_2)
so the points on the graph are above the points before increasing the variable y1.
For 10-13 write an equation to represent the given linear relationship. Then state the meaning of the given ordered pair.
Question 10.
A plain medium pizza costs $8.00. Additional toppings cost $0.85 each. (4, 11.4)
Answer:
y = 0.85 ∙ x + 8
For x = 4 in the equation we get y = 11.4
Question 11.
Luis joined a gym that charges a membership fee of $99.95 plus $7.95 per month. (9, 171.5)
Answer:
y = 7.95 ∙ x + 99.95
For x = 9 in the equation we get y = 171.5
Question 12.
A tank currently holds 35 liters of water, and water is pouring into the tank at 15 liters per minute. (5.5, 117.5)
Answer:
y = 15 ∙ x + 35
For x = 5.5 in the equation we get y = 117.5
Question 13.
Jonas is riding his bicycle at 18 kilometers per hour, and he has already ridden for 40 kilometers. (6, 148)
Answer:
y = 18 ∙ x 40
For x = 6 in the equation we get y = 148
Question 14.
Analyze Relationships How can you use an equation of a linear relationship to verify the points on the graph of the relationship?
Answer:
Let the point A= (p, q) from the graph. By replacing the value in the equation y = mx + b, where x = p, y = q, if the left and right sides are equal, we have confirmed the relation between the equation and the graph.
Question 15.
Multiple Representations A furniture salesperson earns $750 per week plus a 15% commission on all sales made during the week.
a. Complete the table of data.
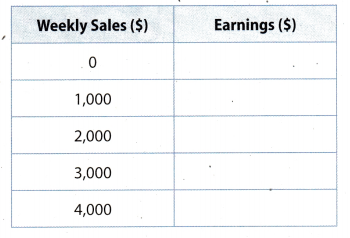
Answer:
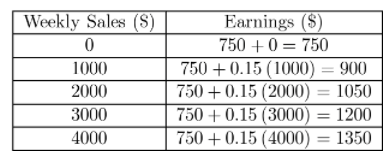
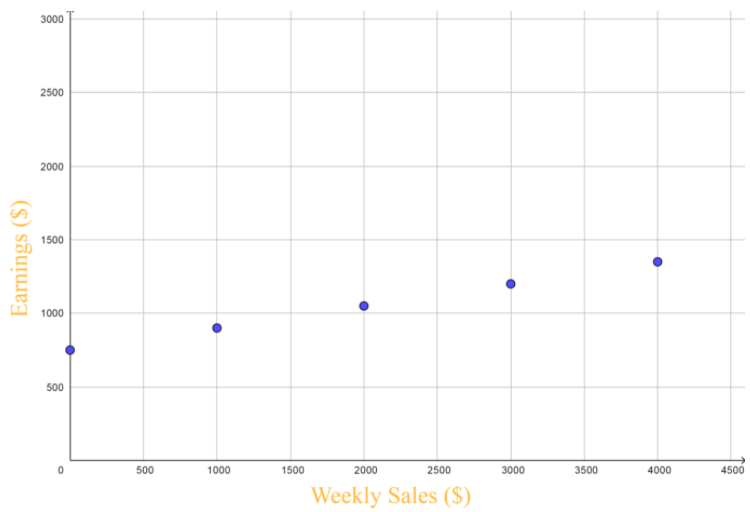
b. Graph the values in the table.
Answer:
c. Write a linear equation to describe the relationship.
Answer:
y = 0.15 ∙ x + 750
Question 16.
Make a Conjecture Can you draw a straight line through the points? Explain.
Answer:
We can for the reason that all points are solutions of the same equation.
H.O.T. Focus on Higher Order Thinking
Question 17.
Analyze Relationships What are the advantages of portraying a linear relationship as a table, graph, or equation?
Answer:
The advantage of graphics, tables and equations is that it helps us to see the changes and understand them in easy way.
Question 18.
Critical Thinking Describe when it would be more useful to represent a linear relationship with an equation than with a graph.
Answer:
It would be more useful to present it through the equation because from the equation for the given value we can easily get points on the graph.
Question 19.
Communicate Mathematical Ideas How can you determine when to draw a line through the points on the graph of a linear relationship?
Answer:
Linear relationship can represent with equation. If all the points on graph are the solutions of the equation, then we can draw a line through them.