Refer to our Texas Go Math Grade 7 Answer Key Pdf to score good marks in the exams. Test yourself by practicing the problems from Texas Go Math Grade 7 Lesson 2.3 Answer Key Proportional Relationships and Graphs.
Texas Go Math Grade 7 Lesson 2.3 Answer Key Proportional Relationships and Graphs
Your Turn
Question 1.
Jared rents bowling shoes for $6 and pays $5 per bowling game. Graph the data. Is the relationship a proportional relationship? Explain.
Answer:
The relationship isn’t proportional, because the points form a line that does not go through the origin.
Example
The graph shows the relationship between time in minutes and the number of miles Damon runs. Write an equation for this relationship.
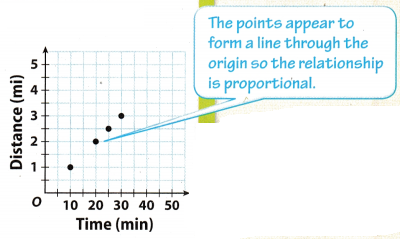
STEP 1: Choose a point on the graph and tell what the point represents.
The point (25, 2.5) represents the distance (2.5 miles) that Damon runs in 25 minutes.
STEP 2: What ¡s the constant of proportionality?
Because distance \(\frac{\text { distance }}{\text { time }}=\frac{2.5 \mathrm{mi}}{25 \mathrm{~min}}=\frac{1}{10}\), the constant of proportionality is \(\frac{1}{10}\).
STEP 3: Write an equation in the form y = kx.
y = \(\frac{1}{10}\)x
Reflect
Question 2.
Communicate Mathematical Ideas What does the point (0, 0) on the graph represent?
Answer:
The point (0, 0) represents a start on the graph, origin.
Question 3.
What If? Esther runs faster than Damon. Suppose you drew a graph representing the relationship between time in minutes and distance run for Esther. How would the graph compare to the one for Damon?
Answer:
Esther’s Line wou[d be steeper than Damon’s
Your Turn
Question 4.
The graph shows the relationship between the distance a bicyclist travels and the time in hours.
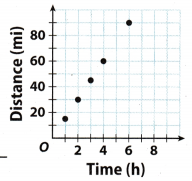
a. What does the point (4, 60) represent?
Answer:
The point (4,60) represents the distance (60 miles) that the bicyclist travels in 4 hours
b. What is the constant of proportionality?
Answer:
The constant is equal to 15 because \(\frac{\text { distance }}{\text { time }}=\frac{60}{4}\) = 15. Only one point is enough since the relationship is proportional.
c. Write an equation in the form y = kx for this relationship.
Answer:
The equation is equal to y = 15x.
Texas Go Math Grade 7 Lesson 2.3 Guided Practice Answer Key
Complete each table. Tell whether the relationship is a proportional relationship. Explain why or why not. xpIore Activity)
Question 1.
A student reads 65 pages per hour.
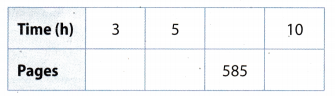
Answer:
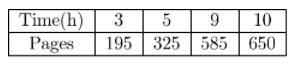
3 × 65 = 195
5 × 65 = 325
585 ÷ 65 = 9
10 × 65 = 650
The relationship is proportional because we made sure with our calculations that all constants are equal to 65.
Question 2.
A babysitter makes $7.50 per hour.
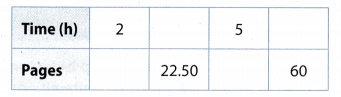
Answer:
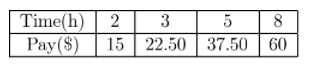
2 × 7.51 = 15
22.50 ÷ 7.50 = 3
5 × 7.50 = 37.5()
60 ÷ 7.50 = 8
The relationship is proportional because we made sure with our calculations that all constants are equal to 7.50.
Tell whether the relationship is a proportional relationship. Explain why or why not. (Explore Activity and Example 1)
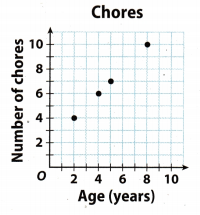
Question 3.
Answer:
The relationship is not proportional because the line does not go through the origin.
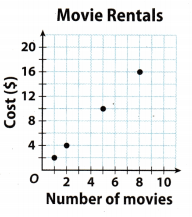
Question 4.
Answer:
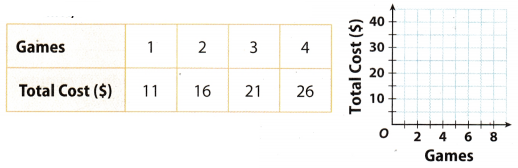
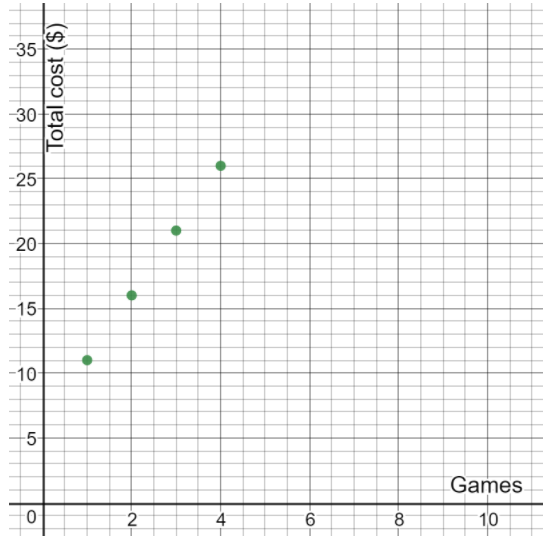
The relationship is proportional, the constant is equal to 2 because \(\frac{2}{1}\) = \(\frac{4}{2}\) = \(\frac{10}{5}\) = \(\frac{16}{8}\) = 2. The equation is equal to y = 2x.
Write an equation of the form y = kx for the relationship shown in each graph.
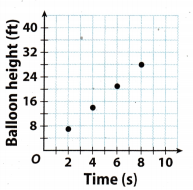
Question 5.
Answer:
The relationship is proportional because points form a line through the origin.
Thus, we need only one point to determine the constant
7 ÷ 2 = 3.5
y = Balloon height(ft)
x = Time(s)
Equation: y = 3.5x
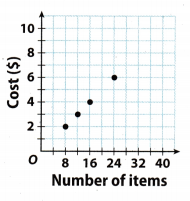
Question 6.
Answer:
The relationship is proportional because points form a line through the origin.
Thus, we need only one point to determine the constant
2 ÷ 8 = 025
y = Cost ($)
x = Number of items
Equation: y = 0.5x
Essential Question Check-In
Question 7.
How does a graph show a proportional relationship?
Answer:
The graph forms a line which passes through the origin.
Texas Go Math Grade 7 Lesson 2.3 Independent Practice Answer Key
For Exercises 8-12, the graph shows the relationship between time and distance run by two horses.
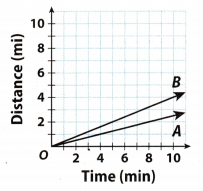
Question 8.
Explain the meaning of the point (0, 0).
Answer:
The point (0,0) represents start, position of horses right before they started to run.
Question 9.
How long does it take each horse to run a mile?
Answer:
We can see from the graph that horse A takes 4 minutes to run a mile, while horse B takes 2.5 minutes to run a mile.
Question 10.
Multiple Representations Write an equation for the relationship between time and distance for each horse.
Answer:
Horse A runs 1 mile in 4 minutes. That means he runs \(\frac{1}{4}\) miles per minute.
Horse B runs 1 mile in 2.5 minutes That means he runs \(\frac{1 \times 2}{2.5 \times 2}\) = \(\frac{2}{5}\) miles per minute.
x = Time (min)
y = Distance(miles)
Horse A: y = \(\frac{1}{4}\) x
Horse B: y = \(\frac{2}{5}\) x
Question 11.
Draw Conclusions At the given rates, how far would each horse run in 12 minutes?
Answer:
Use the equations from 11:
Horse A:
y = \(\frac{1}{4}\) x
y = \(\frac{1}{4}\)(12)3
y = 3
Horse B:
y = \(\frac{2}{5}\) x
y = \(\frac{2}{5}\) (12)
y = \(\frac{25}{4}\)
y = 4\(\frac{4}{5}\)
Horse A passes 3 miles in 12 minutes.
Horse B passes 4\(\frac{4}{5}\) in 12 minutes.
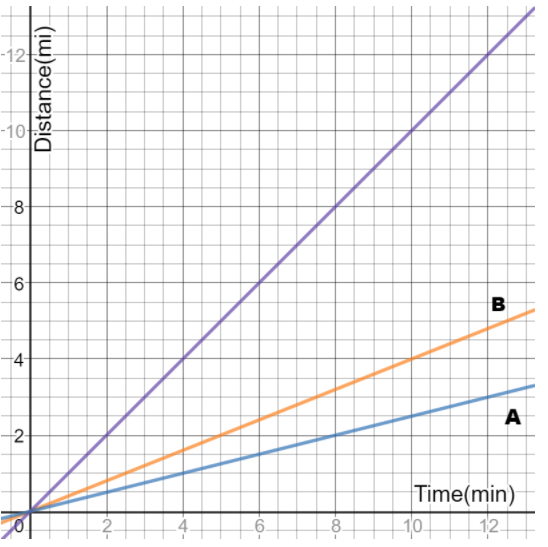
Question 12.
Analyze Relationships Draw a line on the graph representing a horse than runs faster than horses A and B.
Answer:
Question 13.
A bullet train can travel at 170 miles per hour. Will a graph representing distance in miles compared to time in hours show a proportional relationship? Explain.
Answer:
The graph will show a proportional relationship because of the constant unit rate, 170 miles per hour.
Question 14.
Critical Thinking When would it be more useful to represent a proportional relationship with a graph rather than an equation?
Answer:
It would be easier to draw graphs when we have whole numbers
It would not be easy to draw a graph if a constant is a long decimal number, or a fraction with big numbers. Thus, we rather use equation in this case.
Question 15.
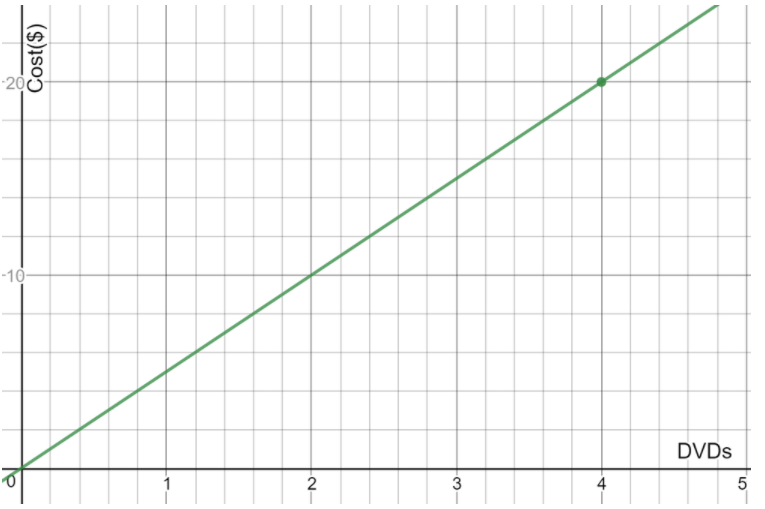
Multiple Representations Bargain DVDs cost $5 each at Mega Movie.
a. Graph the proportional relationship that gives the cost y in dollars of buying x bargain DVDs.
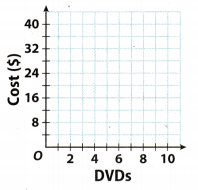
Answer:
Graph
b. Give an ordered pair on the graph and explain its meaning in the real world context.
Answer:
The point (4, 20) represents $20 you have to pay for renting 4 DVDs.
The graph shows the relationship between distance and time as Glenda swims.
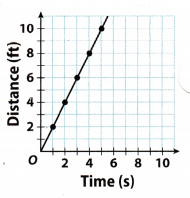
Question 16.
How far did Glenda swim in 4 seconds?
Answer:
Glenda swam 8 feet in 4 seconds.
Question 17.
Communicate Mathematical Ideas Is this a proportional relationship? Explain your reasoning.
Answer:
This is a proportional relationship because points form a line through the origin.
Question 18.
Multiple Representations Write an equation that shows the relationship between time and distance. ________________________________
Answer:
Because the relationship is proportional we can calculate the constant k. From point (2, 4) we conclude the constant is equal to 2.
x = Time(s)
y = Distance(ft)
Thus, the equation is y = 2x.
H.O.T.S Focus On Higher Order Thinking
Question 19.
Make a Conjecture If you know that a relationship is proportional and are given one ordered pair other than (0, 0), how can you find another pair?
Answer:
From the point that is given to us we can draw a line on the graph through that point and (0, 0). Then we can find which ever point we need.
The tables show the distance traveled by three cars.
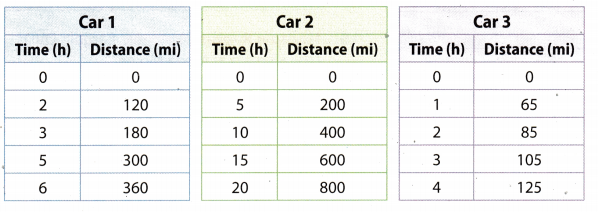
Question 20.
Communicate Mathematical Ideas Which car is not traveling at a constant speed? Explain your reasoning.
Answer:
Car 3 is not traveling at a constant speed because \(\frac{65}{1}\) ≠ \(\frac{85}{2}\).
Question 21.
Make a Conjecture Car 4 is traveling at twice the rate of speed of car 2. How will the table values for car 4 compare to the table values for car 2?
Answer:
The time column will stay the same but the distance column will double its values because the constant doubles.