Refer to our Texas Go Math Grade 6 Answer Key Pdf to score good marks in the exams. Test yourself by practicing the problems from Texas Go Math Grade 6 Lesson 17.5 Answer Key Categorical Data.
Texas Go Math Grade 6 Lesson 17.5 Answer Key Categorical Data
Essential Question
How can you summarize and describe categorical data?
Texas Go Math Grade 6 Lesson 17.5 Explore Activity Answer Key
Explore Activity
Describing Categorical Data
Some data are quantitative, such as height or number of siblings of all students in a class. Other data are qualitative, such as eye color or favorite type of music. Categorical data are data that are sorted into categories on the basis of qualitative characteristics.
You can use the mode to summarize or describe categorical data. The mode of a categorical data set is the category that occurs most often. If all categories have the same frequency, there is no mode.
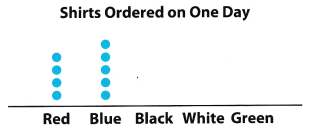
Karl sells red, blue, black, white, and green shirts online. One day Karl received orders for 4 red, 5 blue, 6 black, 6 white, and 3 green shirts.
A. Complete the dot plot of Karl’s shirt orders for the day.
Math Talk
Mathematical Processes
Could the colors in the dot plot be displayed in a different order? Would this change the overall results? Explain.
B. Which shirt color or colors were the most and least popular that day?
Answer:
C. Identify the mode(s) of the data. _______________________________
Answer:
Reflect
Question 1.
Justify Reasoning Is it possible to find the mean or median of Karl’s data set? Explain.
Answer:
It is not possible to find the mean or median of the indicated data set because the data values are not numerical. The categorical data is based on the qualitative characteristics of the shirt
Not possible because the data indicates quality and not quantity.
Your Turn
Question 2.
Chuy has 40 dimes, 20 pennies, 10 nickels, and 10 quarters in his coin jar. Make a relative frequency table of the coins in the jar.
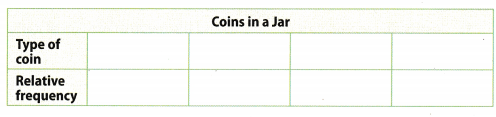
Answer:
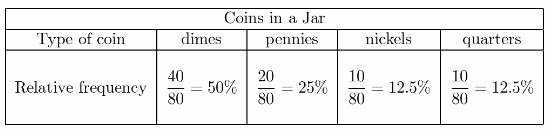
Identify the relative frequency by dividing the number of coins according to type then divide by the total number of coins and multiply by 100.
Reflect
Question 3.
Analyze Relationships Why is it helpful to arrange the categories in the order of their relative frequencies?
Answer:
It is easier to visualize the graph if the categories are arranged in order based on its relative frequency. The percentages of the data can easily be identified and compared to other categories if the height if the graph is determined clearly.
To visualize the relativity of data among indicated categories.
Your Turn
Question 4.
Devon is growing tulips in his garden. He has 24 red tulips, 11 yellow tulips, and 15 purple tulips. Make a percent bar graph and describe the distribution.
Answer:
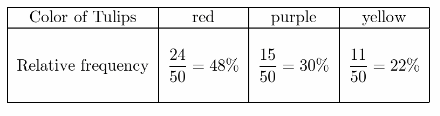
percent bar graph of the data.
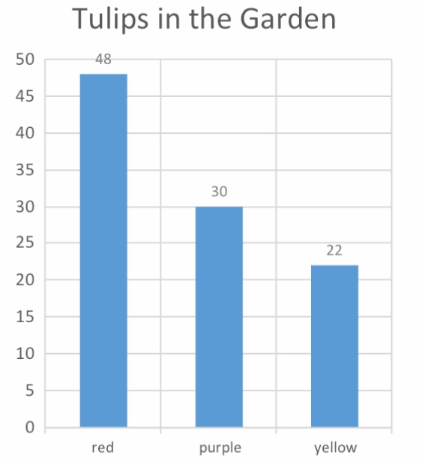
Based on the percent bar graph, almost half of the tulips in the garden are color red.
Texas Go Math Grade 6 Lesson 17.5 Guided Practice Answer Key
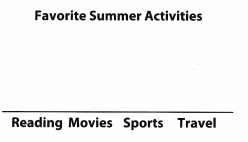
Mrs. Valentine surveyed her class about their favorite Favorite summer activity. Four students chose reading, 7 chose movies, 7 chose sports, and 5 chose travel. (Explore Activity)
Question 1.
Make a dot plot of the data.
Answer:
Dot plot of the data
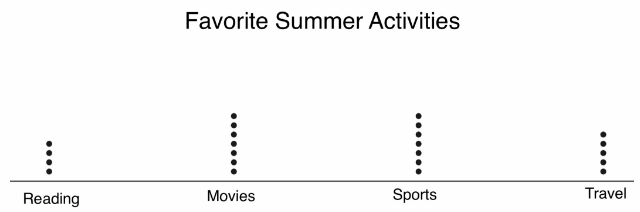
Dot plot of the frequency of the data.
Question 2.
Identify the mode(s) of the data set.
Answer:
The mode of the data set shows the data in which the category occurs most frequent than any other categories. In the indicated data set, the data with the most number of students are those who chose movies and sports.
movies and sports
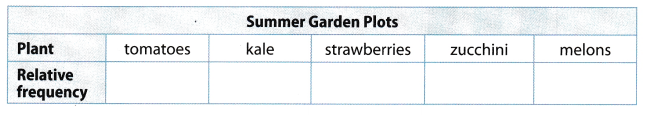
The garden club is planning their spring and summer garden. They have 20 plots. Tomatoes will be in 3 plots, kale will be in 5 plots, strawberries will be In 6 plots, zucchini will be in 2 plots, and melons will be in 4 plots.
Question 3.
Make a relative frequency table of the data that shows both fractions and percents.
Answer:
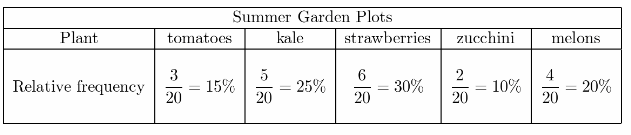
Relative frequency of the given data with percentages.
Question 4.
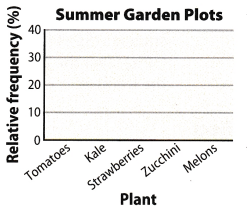
Make a percent bar graph of the relative frequencies of the garden plots.
Answer:
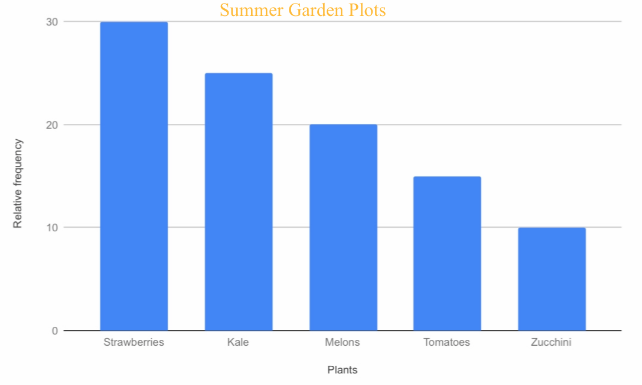
Percent bar graph of the relative frequency of the given data.
Essential Question Check-In
Question 5.
How can you calculate relative frequencies as percents?
Answer:
Relative frequencies can be computed by dividing the frequency of the data by the total number of sample then multiply by 100.
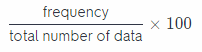
Divide the frequency of each data then divide it by the total number of the data then multiply the result by 100.
Texas Go Math Grade 6 Lesson 17.5 Independent Practice Answer Key
Mr. Anderson’s fifth grade class is getting a class pet. Seven students vote to get a gerbil, 3 vote for a fish, 6 vote for a mouse, and 4 vote for a lizard.
Question 6.
What is the mode of the data set? What does it mean for this situation?
Answer:
In a categorical data, mode is the category that occurs most often. Based from the given data, there is no category with the same frequency. However, the most number of votes on a specific category is having a gerbil for class pet.
The class will choose gerbil for a pet.
Question 7.
If each pet had received 9 votes, what would the mode have been?
Answer:
If all pets will receive the same number of votes, then there will be no value for mode since it cannot be decided which pet to acquire.
There is no visible mode since all pets will receive the same number of votes.
Question 8.
Analyze Relationships Make a dot plot of the data. Use the dot plot to describe the data.
Answer:
Dot plot of the given data
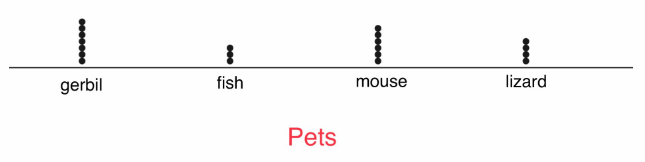
It shows that almost half of the class voted for gerbil to be their class pet
Question 9.
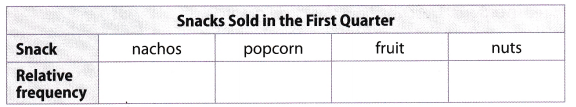
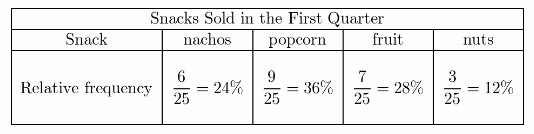
The service club sells snacks at school basketball games. In the first quarter they sell 6 servings of nachos, 4 bags of popcorn, 7 pieces of fruit, and 3 bags of nuts.
a. Make a relative frequency table. Include both fractions and percents.
Answer:
Relative frequency table
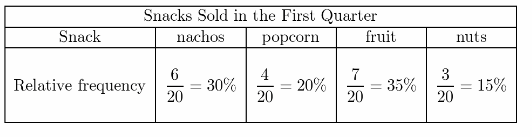
Relative frequency of the data using fraction and percentage.
b. Analyze Relationships Deloria says she can find the relative frequency of nuts based on another relative frequency. What might she be doing?
Answer:
If the relative frequency of nuts is unknown, it can be determined thru the use of other relative frequencies which are available. Add all the given relative frequencies for nachos, popcorn, and fruit then subtract the result from 100 and the relative frequency for nuts will be determined.
30% + 20% + 35% = 85%
100% – 85% = 15%
Add all the available values then subtract from 100.
c. Draw Conclusions If 9 bags of popcorn were sold rather than 4, which relative frequencies would be affected? Explain.
Answer:
Conclusion
All relative frequencies will be affected. Since there was an increase in one of the frequencies therefore the total number of values will also increase while the other relative frequencies will decrease.
If one of the values will increase, its relative frequency will also increase but the other relative frequencies will decrease due to the increase in the total frequency of the data.
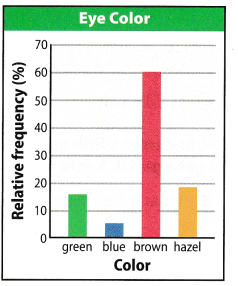
The percent bar graph shows the relative frequencies that resulted from of a survey about eye color.
Question 10.
Draw Conclusions Can you tell from the bar graph how many people were surveyed? Why or why not?
Answer:
The total number of people who were surveyed cannot be determined because the value of the relative frequency is not indicated for each category. The bars show the height for each category.
The data has missing information.
Question 11.
Communicate Mathematical Ideas Describe how the data are distributed.
Answer:
Based from the survey, the dominant eye color is brown and Less than 10 percent of the people who were surveyed have blue eye color.
Sixty percent of the people who were surveyed have brown eye color.
Texas Go Math Grade 6 Lesson 17.5 H.O.T. Focus On Higher Order Thinking Answer Key
Question 12.
What If? Suppose 250 people were surveyed to create the eye color data shown in the graph for Exercises 10 and
Answer:
Determine the number of people who have brown eyes.
\(\frac{n}{250}\) = 60% get the frequency of the people who have brown eye color
[250]\(\frac{n}{250}\) = 0.60 (250) multiply both sides of the equation by 250
n = 150 people who have brown eye color
There are 150 persons with brown eye color
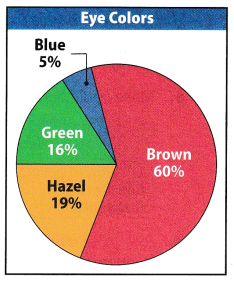
Question 13.
Multiple Representations Describe how this circle graph is similar to and different from the percent bar graph shown for Exercises 10-11.
Answer:
Both graph shows the area of each eye color category. The data for both visual representations can easily be compared by looking at the area of each colored category. The bar graph does not indicate the exact value of the relative frequency for each category while in the pie graph the relative frequency is indicated.
They both represent the indicated data for the eye color and is distributed according to categories. However, they vary in how the data is being displayed since the bar graph does not indicate the relative frequency.
Question 14.
Justify Reasoning Jayshree says the number of dots in a dot plot for Exercise 8 shows that the data is numeric and not categorical. Is she right? Explain. If not, what is her mistake?
Answer:
The data in the dot plot shows the number of votes each pet gets. Jayshree made a mistake because the data is categorical as it displays the type of pet the class wants to get.
The data is categorical