Refer to our Texas Go Math Grade 6 Answer Key Pdf to score good marks in the exams. Test yourself by practicing the problems from Texas Go Math Grade 6 Lesson 17.3 Answer Key Dot Plots and Data Distribution.
Texas Go Math Grade 6 Lesson 17.3 Answer Key Dot Plots and Data Distribution
Essential Question
How can you summarize and display numeric data?
Texas Go Math Grade 6 Lesson 17.3 Explore Activity Answer Key
Explore Activity 1
Variable Data and Statistical Questions
The question “How much does a typical cat weigh?” is an example of a statistical question. A statistical question is a question that has many different, or variable, answers.
A. Decide whether each of the situations below could yield variable data.
1. Your sister wants to know the typical weight for an adult cat. ____
2. You want to know how tall your friend is. ____
3. You want to know how far your house is from school, ____________
4. A car owner wants to know how much money people usually pay for a new tire. ____________
5. How many students were in line for lunch at the cafeteria today at 12:30? _______________
B. For which of the situations in part A can you write a statistical question? Write questions for these situations.
Reflect
Question 1.
Choose one of the questions you wrote in part B. How might you find answers to this question? What units would you use for the answers?
Answer:
- Question: How much is the cost of a new tire?
- The answers might be taken from the published amount through the websites of the tire manufacturing company. Or through interview from tire shops or people who have purchased car tire recently.
- Currency: Dollars
The cost of a new tire can be determined through interview from selected respondents.
Reflect
Question 2.
How many games did the team play during the season? How can you tell from looking at the dot plot?
Answer:
The team played 19 games during the season based on the number of dots. It was shown on the dot plot because the dots above the number line represents the frequency of data.
The dots on the number line indicate 19 games.
Question 3.
At how many games did the team score 2 runs or fewer? How do you know?
Answer:
The team scored 2 runs or fewer in 10 games based on the number of dots indicated on points 0, 1, and 2 of the dot plot.
10 games
Your Turn
Question 4.
A different baseball team scores the following numbers of runs in its games for several weeks:
4, 4, 6, 1, 2, 4, 1, 2, 5, 3, 3, 5, 4, 2
Use the data to make a dot plot. Tell how many games the team played, and identify the data value with the greatest frequency.
Answer:
Dot plot of the given data
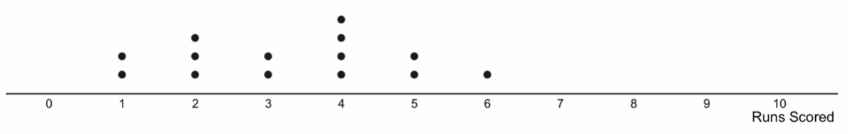
The numbers on the line represent me runs scored by the team while the dots represent me number of games made for each run. Based from the dot plot and by counting the dots, the team played 14 games with 4 runs as the data value with the greatest frequency.
They played 14 games and the data with the greatest frequency is 4 runs.
Your Turn
Question 5.
Describe the spread, center, and shape of the data distribution from Example 1.
Answer:
The data values are spread out from 0 to 11 with data value of 11 as an outlier. The data has a cluster from 0 to 7 with one peak at 2, which is the center of distribution. The distribution is not symmetric as the data values are clustered at one end of the distribution.
The data showed one outlier and non symmetric.
Your Turn
Question 6.
Find the mean, median, and range of the data from Your Turn question 4. What is the typical number of runs the team scores in a game? Justify your answer.
Answer:
Determine the mean, median, and range of the given data.
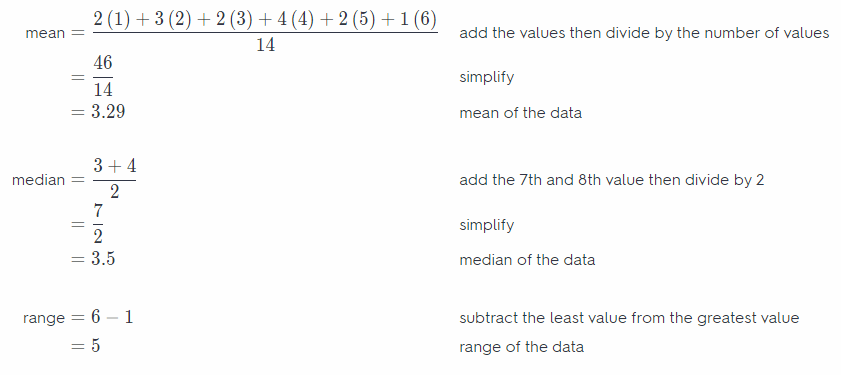
The mean of the data is about 3.29 while the median is 3.5, and the range is 5. Since the mean and median have closer values, it shows that the more typical number of runs the team scores in a game is around 3 to 4 runs.
Texas Go Math Grade 6 Lesson 17.3 Guided Practice Answer Key
Tell whether the situation could yield variable data. If possible, write a statistical question.
Question 1.
The town council members want to know how much recyclable trash a typical household in town generates each week.
Answer:
The given situation can give variabLe data depending on the consumption of each household due to the number of people. The statistical question could be, how much recyclable trash in the household can be generated in a week?
How much recyclable trash are there in your house each week?
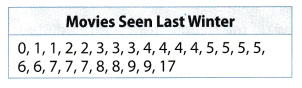
Kate asked some friends how many movies they saw last winter. Use her data for 2 and 3.
Question 2.
Make a dot plot of the data. (Example 1)
Answer:
Dot plot for the given data
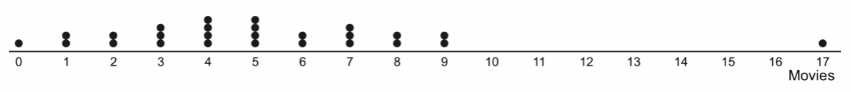
Dot plot of the movies seen last Winter.
Question 3.
Find the mean, median, and range of the data. (Example 3)
Answer:
Determine the mean, median, and range of the given data.
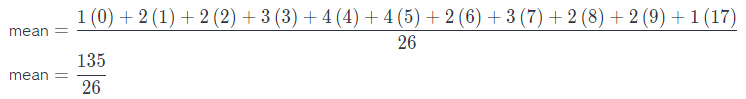
mean = 5.19
median = 5
range = 17 – 0
range = 17
Mean = 5.19
Median = 5
Range = 17
Question 4.
Describe the spread, center, and shape of the data. (Example 2)
Answer:
The data values are spread out from 0 to 17 with a data value 17 that appears to be an outlier. The data is clustered from 0 to 9 with two peaks at 4 and 5 which represents the value with the greatest frequency. Without the outlier, the distribution is symmetric and clustered around the center of the distribution.
Without the outlier, the distribution is symmetric.
Essential Question Check-In
Question 5.
What are some measures of center and spread that you can find from a dot plot? How can making a dot plot help you visualize a data distribution?
Answer:
Mean, median, and range can easily be identified using a dot plot since the dots represent the value of the data in a distribution. It also shows the frequency of the data value because the number of dots placed above the number line denotes the number of times a value has been given in the data. It can also help visualize the cluster of data represented whether it is symmetric or not.
The dots help visualize the mean, mean, and range of a given data.
Texas Go Math Grade 6 Lesson 17.3 Independent Practice Answer Key
Question 6.
Vocabulary Describe how a statistical question yields an answer with variability. Give an example.
Answer:
A question is statistical if there is variation in the responses. If the question only specifies one answer, then it is not statistical since there is only one particular answer. However, if the question has varied responses then it becomes statistical. For example, determine the time spent watching television on Sunday by all students in the classroom.
Statistical question generates varied responses.
For 7-10, determine whether the question is a statistical question. If it is a statistical question, identify the units for the answer.
Question 7.
An antique collector wants to know the age of a particular chair in a shop.
Answer:
It is not a statistical question because the expected answer is very specific as to the age of a particular chair in the shop.
Not a statistical question.
Question 8.
How tall do the people in your immediate and extended family tend to be?

Answer:
It is a statistical question because the responses may vary since the data will be the height of different members of the immediate and extended family. The unit that can be used to measure the height is inches or centimeters.
A statistical question because it generates varied responses.
Question 9.
How tall is Sam?
Answer:
It is not a statistical question because the expected answer is very specific as to the height of Sam.
Not a statistical question because there is only one answer.
Question 10.
How much did your classmates typically spend on music downloads last year?
Answer:
It is a statistical question because the responses may vary since the data will be the time spent for music downloads of the students and not of a particular person only. The unit that can be used to measure the time is hours or minutes.
A statistical question because of different responses from the classmates.
For 11-14, use the following data. The data give the number of days of precipitation per month during one year in a city.
![]()
Question 11.
Make a dot plot of the data.
Answer:
Dot plot for the given data
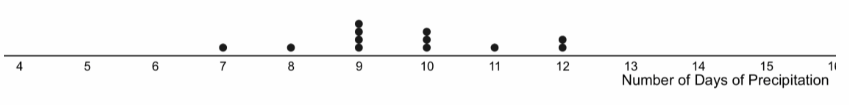
The dot plot for the data on the number of days of precipitation per month.
Question 12.
What does each dot represent? How many months are represented?
Answer:
The dot represents the value of the data taken from the number of days of precipitation per month. The number of dots represent the number of months which is 12 months.
Each dot represents the number of days while the number of dots represent the total number of months the data
was gathered.
Question 13.
Describe the shape, center, and spread of the data distribution. Are there any outliers?
Answer:
The data values are spread out from 7 to 12 with no outlier. The data is cLustered from 7 to 12 with one peak at 9 which represents the value with the greatest frequency. The distribution is not symmetric because the data values are clustered at one end of the distribution.
The data has no outlier and the distribution is not symmetric.
Question 14.
Find the mean, median, and range of the data.
Answer:
Determine the mean, median, and range of the given data.
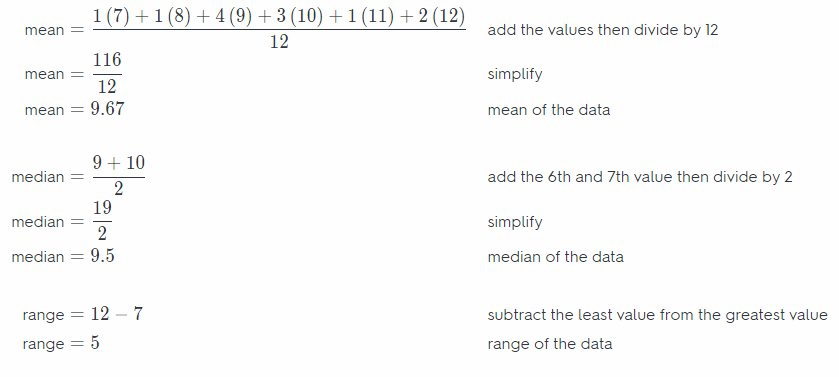
Mean = 9.67
Median = 9.5
Range = 5
Question 15.
What If? During one month there were 7 days of precipitation. What if there had only been 3 days of precipitation that month? How would that change the measures of center?
Answer:
Determine the mean, median, and range of the given data.
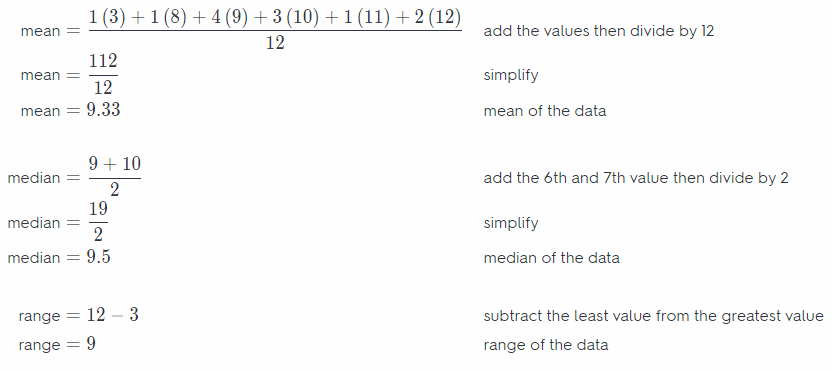
When the least data was changed, the value of mean and range also changed. The mean vaLue of 9.33 is less than the original mean and the range value of 9 is greater than the original range.
For 16 and 17, use the dot plot of the number of cars sold at a car dealership per week during the first half of the year.
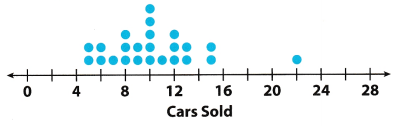
Question 16.
Find the mean, median, and range.
Mean= ______ Median= ______
Range = ________
Answer:
Determine the mean, median, and range of the given data.
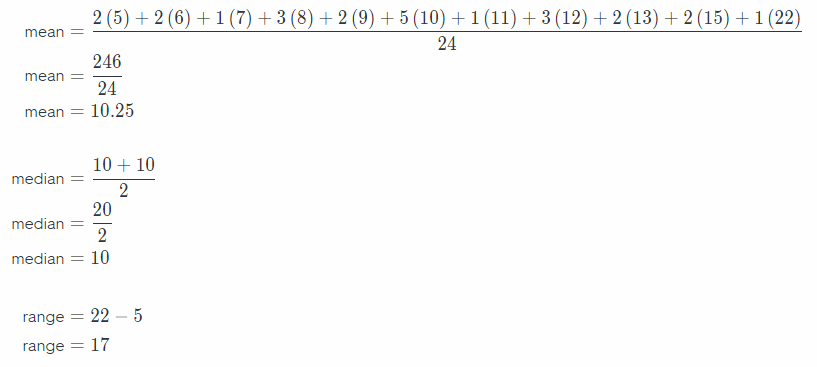
Mean = 10.25
Median = 10
Range = 17
Question 17.
The owner of the car dealership decides to treat the value 22 as an outlier. Which measure of center or spread is affected the most if the owner removes this outlier? Explain.
Answer:
If the value of 22 will be considered as an outlier, the affected measure of center or spread ¡s the value of the mean and the range. The mean value of 9.74 and range value of 10 is lesser than the original mean and range value.
The value of mean and range are affected by the outlier.
Question 18.
How many cars are sold in a typical week at the dealership? Explain.
Answer:
There are about 10 cars that were sold in a week based on the given data. It is determined thru the computed value of the mean about 10 cars
Question 19.
Write an expression that represents the total number of cars sold during the first half of the year.
Answer:
The total number of cars sold during the first half of the year is 246 cars.
246 cars
Question 20.
Describe the spread, center, and shape of the data distribution.
Answer:
The data values are spread out from 5 to 22 with a data value 22 that appears to be an outlier. The data is c[ustered from 5 to 15 with one peak at 10 which represents the value with the greatest frequency. Without the outlier, the distribution is symmetric and clustered around the center of the distribution.
The data has one outlier and the distribution is symmetric if the outlier is not included.
Question 21.
Vocabulary Explain how you can tell the frequency of a data value by looking at a dot plot.
Answer:
The number of dots above a specific data value indicates the frequency of that data. For the given dot plot on item 16, it shows that there are 5 dots on the point 10, it means that the data value of 10 appears five times in the gathered data.
Number of dots indicate the frequency of the data value.
For 22—26 use the following data. The data give the number of runs scored by opponents of the Boston Red Sox in June 2010.
4, 4, 9, 0, 2, 4, 1, 2, 11, 8, 2, 2, 5, 3, 2, 5, 6, 4, 0
Question 22.
Make a dot plot for the data.
Answer:
Dot plot of the given data.
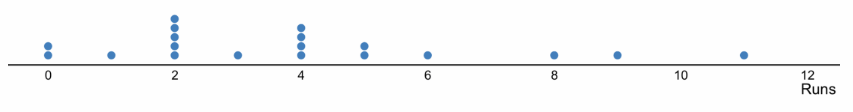
The dot plot based on the number of runs scored by the opponents of Boston Red Sox
Question 23.
How many games did the Boston Red Sox play in June 2010? Explain.
Answer:
The data has 19 entries which indicates that the Boston Red Sox played 19 games in June 2010.
19 games
Question 24.
Which data value in your dot plot has the greatest frequency? Explain what that frequency means for this data.
Answer:
The data value with the greatest frequency is at point 2. It shows that the opponent of Boston Red Sox had more two runs.
The greatest frequency falls on point 2 of the dot plot
Question 25.
Find the mean, median, and range of the data.
Answer:
Determine the mean, median, and range of the given data.
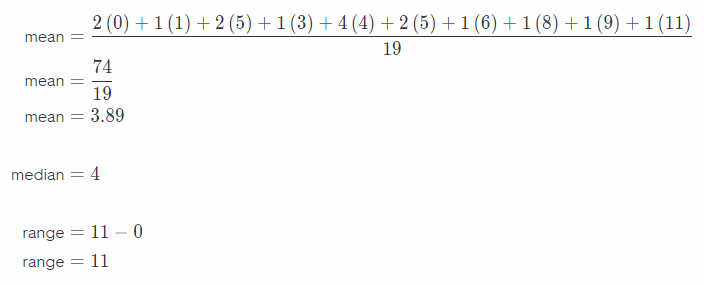
mean = 3.89
median = 4
range = 11
Question 26.
What is a statistical question that you could answer using the dot plot? Answer your question and justify your response.
Answer:
How many games did the opponent of the Boston Red Sox got with the given the number of runs?
They scored the following:
0 runs – 2 games
1 run – 1 game
2 runs – 5 games
3 runs – 1 game
4 runs – 4 games
5 runs – 2 games
6 runs – 1 game
8 runs – 1 game
9 runs – 1 game
11 runs – 1 game
The statistical question could be, how many games did the opponents scored with the given number of runs.
Texas Go Math Grade 6 Lesson 17.3 H.O.T. Focus On Higher Order Thinking Answer Key
Question 27.
A pediatrician records the ages of the patients seen in one day:
1, 2, 5, 7, 9, 17, 13, 16, 18, 12, 3, 5, 1.
a. Explain the Error Assuming that some of the patients are infants who are less than 1 year old, what information did the pediatrician forget to write down?
Answer:
The data is about the ages of the patients and based on the situation, there are infants who are less than 1 year old. There is an error on the data because the unit of measurement is not indicated. Ages can be measured by year or months.
The unit of measurement is missing from the data.
b. Critical Thinking Can you make a dot plot of the pediatrician’s data? Can you find the mean, median, and range? Why or why not?
Answer:
A dot plot cannot be created because the unit of measurement is not indicated in the data. Thus, the value of the mean, median, and range cannot also be computed.
There was an error in the data gathering therefore a dot plot cannot be created.
Question 28.
Multistep A nurse measured a patient’s heart rate at different times over several days.
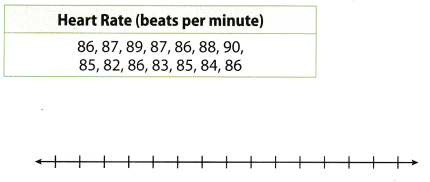
a. Make a dot plot.
Answer:
Dot plot for the given data
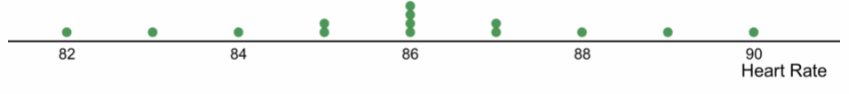
The dot plot of the heart rate of a patient at different time intervals.
b. Describe the shape, center, and spread of the data. Then find the mean, median, range, and IQR for the data.
Answer:
The data values are spread out from 82 to 90 with no outlier. The data is clustered from 82 to 90 with one peak at 86 which represents the value with the greatest frequency. The distribution is symmetric and clustered around the center of the distribution.
Determine the mean, median, range, and IQR of the given data.
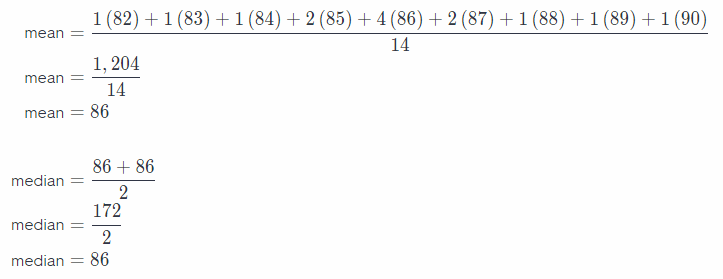
range = 90 – 82
range = 8
IQR = 87.5 – 84.5
IQR = 3
The distribution is symmetric.
c. What If? The nurse collected the data when the patient was resting. How might the dot plot and the measures change if the nurse collects the data when the patient is exercising?
Answer:
If the data values to be collected will be coming from a patient who is exercising then the heart rate will be different because of the level of exercise that he will be doing. The dot plot and the measure of change will also vary depending on the gathered data from the patient who is exercising.
The dot plot and measure of center and spread may vary based on the heart rate of an exercising patient.