Refer to our Texas Go Math Grade 6 Answer Key Pdf to score good marks in the exams. Test yourself by practicing the problems from Texas Go Math Grade 6 Lesson 17.2 Answer Key Box Plots.
Texas Go Math Grade 6 Lesson 17.2 Answer Key Box Plots
Essential Question
How can you use a box plot and measures of spread to describe a data set?
Reflect
Question 1.
In the example, what percent of the data values are included in the box portion? What percent are included in each of the “whiskers” on the ends of the box? _________________
Answer:
The data values included in the box portion represents 50% of the data while the data values included in each whiskers represents 25% on both sides.
Percentage for data in the box is 50%.
Percentage for the data on the ends of the box is 25% each side.
Your Turn
Question 2.
The daily high temperatures for some days last month are shown. Make a box plot of the data.
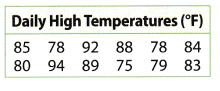
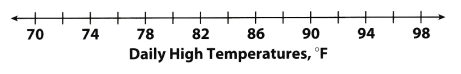
Answer:
Box plot of the data
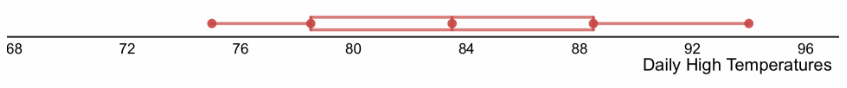
The box plot of the data on daily high temperatures.
Your Turn
Question 3.
The box plots compare the weekly earnings of two groups of salespeople from different clothing stores. Find and compare the IQRs of the box plots.
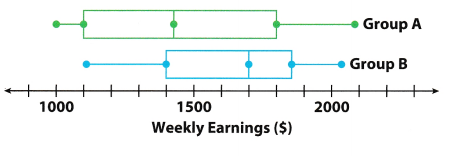
Answer:
Determine the IQR of both groups then compare.
IQRA = 1,800 – 1,100 subtract the lower quartie from the upper quarti[e
= 700
IQRB = 1, 850 – 1,400 subtract the lower quartie from the upper quartile
= 450
The IQR of Group A is greater than the IQR of Group B. The weekly earnings of Group A are more spread out than Group B.
Your Turn
Question 4.
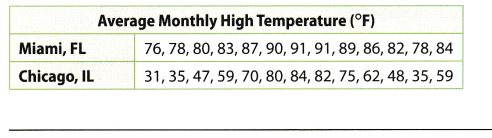
Find the range of each set of data. Which city’s data has a greater range?
Answer:
Arrange the data in ascending order
- Miami, FL: 76, 78, 78, 80, 82, 83, 84, 86, 87, 89, 90, 91, 91
- Chicago, IL: 31, 35, 35, 47, 48, 59, 59, 62, 70, 75, 80, 82, 84
Determine the range of each set of data.
range = 91 – 76 subtract the least value from the greatest value
= 15 range of the data for Miami
range = 84 – 31 subtract the least value from the greatest value
= 53 range of the data for Chicago
The city with a greater range of 53 is Chicago.
Texas Go Math Grade 6 Lesson 17.2 Guided Practice Answer Key
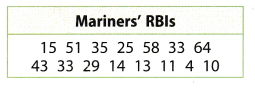
The RBIs (runs batted in) for 15 players from the 2010 Seattle Mariners are shown. Use this data set for 1—7.
Question 1.
Order the data from least to greatest. (Example 1)
_________________
Answer:
Arrangement of data in ascending order.
4, 10, 11, 13, 14, 15, 25, 29, 33, 33, 35, 43, 51, 58, 64
The data is 4, 10, 11 , 13, 14, 15, 25, 29, 33, 33, 35, 43, 51, 58, 64 when arranged from least to greatest
Question 2.
Find the median.(Example 1) _______
Answer:
Arrange the data in ascending order
4, 10, 11, 13, 14, 15, 25, 29, 33, 33, 35, 43, 51, 58, 64
Median is the middle value in the given data.
Median is 29.
The median of the data is 29.
Question 3.
Find the lower quartile.(Example 1) _______
Answer:
Arrangement of data in ascending order
4, 10, 11, 13, 14, 15, 25, 29, 33, 33, 35, 43, 51, 58, 64
Determine the lower quartile by getting the median of the lower half of the data set
lower quartile is 13.
The lower quartile of the data is 13.
Question 4.
Find the upper quartile. (Example 1) _______
Answer:
Arrangement of data in ascending order
4, 10, 11, 13, 14, 15, 25, 29, 33, 33, 35, 43, 51, 58, 64
Determine the upper quartile by getting the median of the upper half of the data set.
Upper quartile is 43.
The upper quartile of the data is 43.
Question 5.
Make a box plot for the data. (Example 1)
Answer:
Box plot of the given data

The box plot of the data showing the runs battled in for the Seattle Mariners.
Question 6.
Find the IQR. (Example 2) _____
Answer:
Determine the IQR for the given data.
IQR = 43 – 13 subtract the lower quartile from the upper quartile
= 30
The value of the interquartile range is 30.
Question 7.
Find the range. (Example 3) _____
Answer:
Determine the range of the given data.
range = 64 – 4 subtract the least value from the greatest value in the data
= 60
The range of the data is 60.
Essential Question Check-In
Question 8.
How is the range of a set of data different from the IQR?
Answer:
The range is the spread of the data because the value came from the difference between the largest and the least data. The interquartile range is the spread of the middle 50% of the data because the value came from the difference between the upper and lower quartile of the data.
Range is the difference between the greatest and least data while the interquartile range focuses on the middle 50% of the data.
Texas Go Math Grade 6 Lesson 17.2 Independent Practice Answer Key
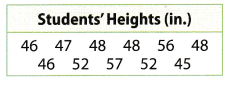
For 9-12, use the data set of the heights of several different students.
Question 9.
Draw a box plot of the data.
![]()
Answer:
Box plot of the given data

The box plot of the height of the students in inches.
Question 10.
How many students are included in the data set? _____
Answer:
There are 11 entries in the data set for the height of the students. It shows that there are 11 students included in the data set
11 students
Question 11.
What method could have been used to collect the data?
Answer:
In order to get the accurate height of the students, one must have a one-to-one interaction between the data gatherer and the respondent. With the given data set, the method that was used to gather the information is through interview with the selected students.
The data collection was done through interview method.
Question 12.
Represent Real-World Problems What other data could you collect from the students to create a box plot? Provide several examples with units of measurement, if applicable.
Answer:
Data that can be collected from the students.
- Weight of the students: 40 pounds, 42 pounds, 43 pounds, 43 pounds, 45 pounds, 45 pounds, 48 pounds, 48 pounds, 48 pounds, 50 pounds, 50 pounds
- Grades in Math: 90, 90, 90, 92, 92, 93, 94, 94, 94, 95, 95
- Age: 5, 5, 5, 5, 6, 6, 6, 7, 7, 7, 8
There are different data that can be collected from the students like their weight, age, and grade in a subject area.
For 13-15, use the box plots of the total precipitation for the same group of cities for the months of January and June.
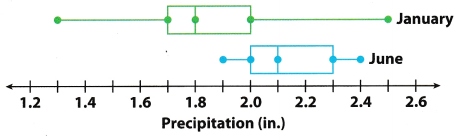
Question 13.
Calculate the IQR for each month.
January = ___ inches June = ___ inches
Answer:
Determine the interquartile range of the given box plot
IQR = 2.0 – 1.7 subtract the lower quartile from the upper quartile
= 0.3 inches interquartile range for January
IQR = 2.3 – 2.0 subtract the lower quartile from the upper quartile
= 0.3 inches interquartile range for June
The interquartile range to January and June are both 0.3 inches.
Question 14.
Calculate the range for each month.
January = ___ inches June = ___ inches
Answer:
Determine the range of the given box plot.
range = 2.5 – 1.3 subtract the least value from the greatest value
= 1.2 inches range of the data for January
range = 2.4 – 1.9 subtract the least value from the greatest value
= 0.5 inches range of the data for June
The range for each month is:
January = 1.2 inches
June = 0.5 inches
Question 15.
Compare the IQRs. What can you conclude about the two data sets?
Answer:
The data has the same interquartile range. It denotes that the spread of the middle 50% of the data are the same same interquartile range
Question 16.
Compare the ranges. What can you conclude about the two data sets?
Answer:
The range of the precipitation in January is 1.2 inches while in June it is 0.5 inches. It shows that there is a greater spread of data in January than in June.
The data is widely spread in January than in June.
Texas Go Math Grade 6 Lesson 17.2 H.O.T. Focus On Higher Order Thinking Answer Key
Question 17.
Analyze Relationships Can two box plots have the same range and IQR and yet represent completely different data? Explain.
Answer:
Yes it is possible for two box pLots to have the same range and IQR although they have different data sets as long as the median, lower quartile, and upper quartile are the same. Since range and IQR both determines the measure of spread of the data.
Yes, both are measures of spread of the data.
Question 18.
Multiple Representations Matthew collected data about the ages of the actors in two different community theater groups. He drew a box plot for one of the sets of data.
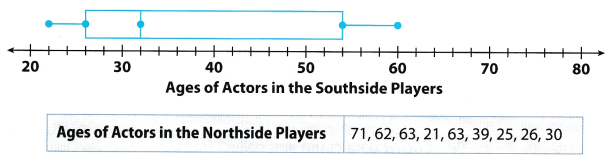
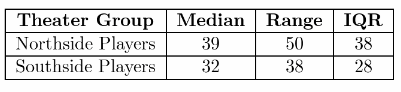
a. Find the median, range, and IQR for each set of data.
Answer:
b. Suppose you were to draw a second box plot for the Northside Players using the same number line as for the Southside Players. Which box plot would be longer overall? Which would have the longest box portion?
Answer:
The box plot for Northside Players is much longer than the box plot of Southside Players. The diagram for Northside Players has the longest box portion.
Box plot for the Northside Players

c. Critique Reasoning Mandy assumes that because nine data values are shown for the Northside Players, nine data values were used to make the box plot for the Southside Players. Explain why this is not necessarily true.
Answer:
In creating box plot, the only data being used are the least and greatest value of the data, lower and upper quartile together with the median. Not all values of the data set will be used in creating a box plot.