Refer to our Texas Go Math Grade 5 Answer Key Pdf to score good marks in the exams. Test yourself by practicing the problems from Texas Go Math Grade 5 Lesson 14.2 Answer Key Graph Data.
Texas Go Math Grade 5 Lesson 14.2 Answer Key Graph Data
Essential Question
How can you use a coordinate grid to display data collected in an experiment?
Investigate
Materials
- paper cup
- water
- Fahrenheit thermometer
- ice cubes
- stopwatch
When data is collected, it can be organized in a table.
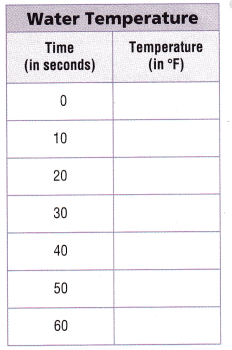
A. Fill the paper cup more than halfway with room-temperature water.
B. Place the Fahrenheit thermometer in the water and find its beginning temperature before adding any ice. Record this temperature in the table at 0 seconds.
C. Place three cubes of ice in the water and start the stopwatch. Find the temperature every 10 seconds for 60 seconds. Record the temperatures in the table.
Make Connections
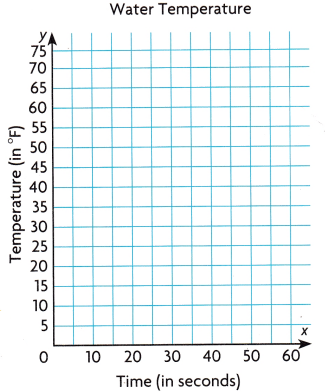
You can use a coordinate grid to graph and analyze the data you collected in the experiment.
Step 1
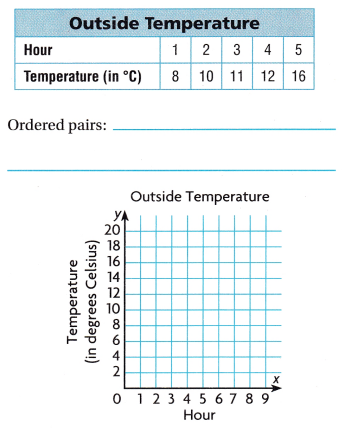
Write the related pairs of data as ordered pairs.
(0, ___) (30, ___) (50, ___)
(10, ___) (40, ____) (60, ___)
(20, ___)
Step 2
Construct a coordinate grid and write a title for it. Label each axis.
Step 3
Plot a point for each ordered pair.
Math Talk
Mathematical Processes
Analyze your observations about the temperature of the water during the 60 seconds
Share and Show
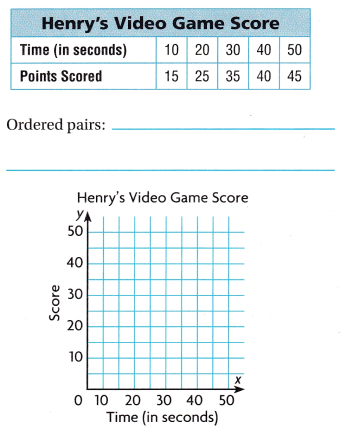
Graph the data In the coordinate grid.
Question 1.
Answer:
Question 2.
Answer:
Problem Solving
Use the table at the right for 3-4.
Question 3.
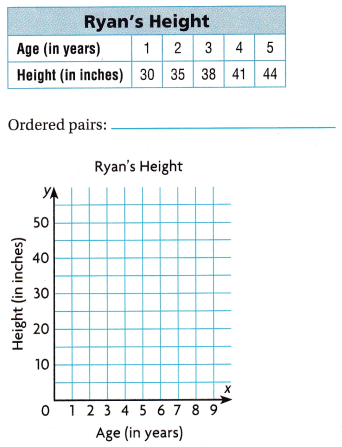
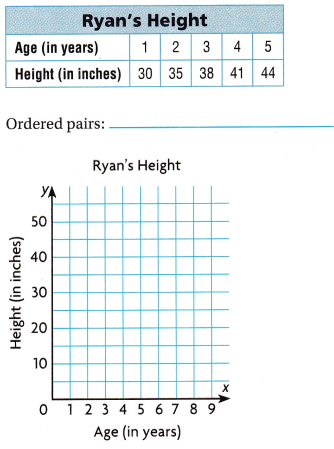
Multi-Step Write ordered pairs to show the relationship between the month and the weight ola bird. Plot each point in the coordinate grid.
Answer:
Question 4.
H.O.T. Analyze What do you think would happen to the bird’s eight over the next four months?
Answer:
H.O.T. What’s the Error?
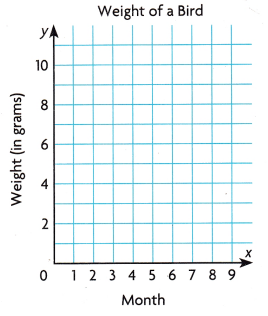
Question 5.
Mary places a miniature car onto a track with launchers. The speed of the car is recorded every foot. Some of the data is shown in the table. Mary graphs the data in the coordinate grid below.
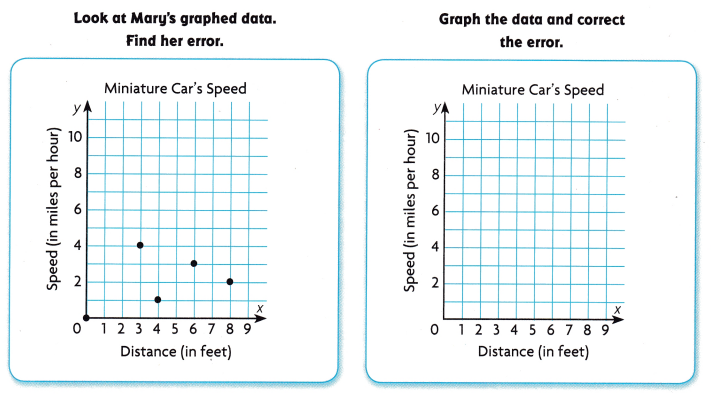
Answer:
Question 6.
Communicate Describe the error Mary made.
Answer:
Question 7.
Reasoning Where do you think the miniature car will stop? Write the ordered pair. Explain.
Answer:
Daily Assessment Task
Fill in the bubble completely to show your answer.
Question 8.
The graph shows the relationship between the length of an eruption of Old Faithful, x and the length of time until the next eruption, y. Which of these ordered pairs is on the graph?
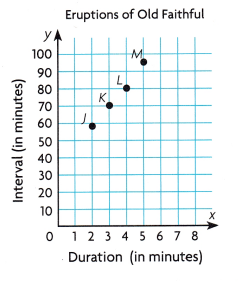
(A) (95, 5)
(B) (2, 50)
(C) (70, 3)
(D) (4, 80)
Answer:
Question 9.
Which set of ordered pairs shows the data In the table?
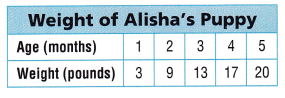
(A) (1 ,2), (3, 4), (5, 3), (9, 13), (17, 20)
(B) (1, 3),(2, 9),(3, 13),(4, 17), (5, 20)
(C) (20, 5), (17, 4), (13, 3), (9, 2), (3, 3)
(D) (1, 3), (9, 2), (13, 3), (4, 17), (20, 5)
Answer:
Question 10.
Multi-Step Sean is growing a plant in a jar. He makes a graph to show the days since he put the seed in the jar, and the length of the longest root (in centimeters). He first sees the root in 4 days, and he writes the ordered pair (4, 2). Three days later, the root measures 18 cm. Five days later, it has grown another 25 cm. What ordered pairs does Sean add to his graph?
(A) (7, 18), (12, 43)
(B) (18, 3), (25, 5)
(C) (3, 18), (5, 25)
(D) (18, 7), (43, 12)
Answer:
Texas Test Prep
Question 11.
Marie was in fifth grade when she began to record her baby sister’s height and her own height in inches every six months for 3 years. She plots the data on a graph where the x-coordinate represents her sister’s height and the y-coordinate represents Marie’s height. Which ordered pair could NOT be on the graph?
(A) (24, 51)
(B) (33, 60)
(C) (55, 30)
(D) (28, 52)
Answer:
Texas Go Math Grade 5 Lesson 14.2 Homework and Practice Answer Key
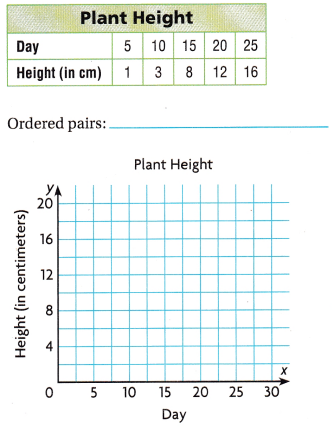
Graph the data in the coordinate grid.
Question 1.
Answer:
Question 2.
Answer:
Problem Solving
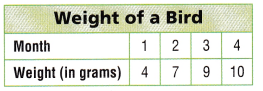
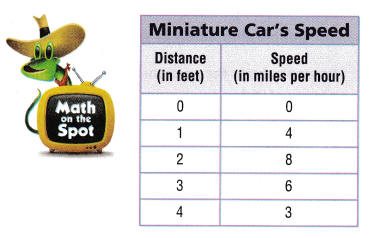
Use the table at the right for 3-4.
Question 3.
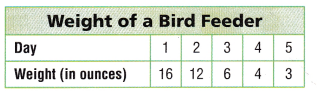
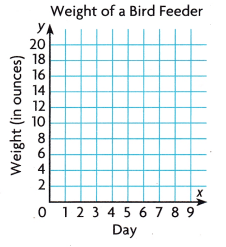
Write ordered pairs to show the relationship between the day and the weight of the bird feeder. Plot each point in the coordinate grid.
Answer:
Question 4.
Do you think the weight of the bird feeder will be 10 ounces on day 6? Explain.
Answer:
Fill in the bubble completely to show your answer. Use the graph for 5-6.
Question 5.
The graph shows the relationship between the length of time and the number of kernels popped. Which of these ordered pairs is on the graph?
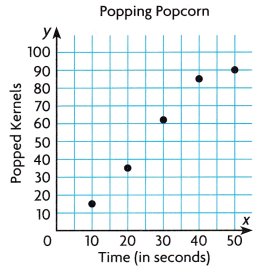
(A) (20, 35)
(B) (10, 20)
(C) (85, 40)
(D) (90, 50)
Answer:
Question 6.
The number of popped kernels stays the same after 50 seconds. Which ordered pair can you plot to show the number of popped kernels after 60 seconds.
(A) (50, 90)
(B) (90, 50)
(C) (60, 90)
(D) (90, 60)
Answer:
Question 7.
Marc plots the point (1, 20) in a coordinate grid to show the number of minutes it takes him to walk 1 mile. Which ordered pair might Marc use to show how many minutes it takes him to walk 3 miles?
(A) (3, 3)
(B) (60, 3)
(C) (30, 3)
(D) (3, 60)
Answer:
Question 8.
Multi-Step Which set of ordered pairs shows the data in the table?
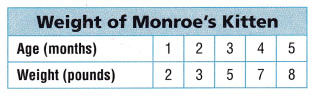
(A) (1, 2), (3, 4), (5, 2), (3, 5), (7, 8)
(B) (8, 5), (7, 4), (5, 3), (3, 2), (1, 1)
(C) (1, 2), (3, 2), (5, 3), (7, 4), (8, 5)
(D) (1, 2), (2, 3), (3, 5), (4, 7), (5, 8)
Answer:
Question 9.
Multi-Step Jo measures a puddle as it evaporates. After the first hour, the puddle is 10 cm long. She plots the point (1, 10) in a coordinate grid. After 2 hours, the puddle is 5 cm long. After 3 hours, the puddle is 2 cm long. Which ordered pairs should Jo plot to show the data?
(A) (2, 5), (3, 2)
(B) (5, 2), (2, 3)
(C) (1, 5), (2, 2)
(D) (2, 15), (3, 7)
Answer: