Refer to our Texas Go Math Grade 4 Answer Key Pdf to score good marks in the exams. Test yourself by practicing the problems from Texas Go Math Grade 4 Unit 5 Answer Key Data Analysis.
Texas Go Math Grade 4 Unit 5 Answer Key Data Analysis
Show What You Know
Check your understanding of important skills.
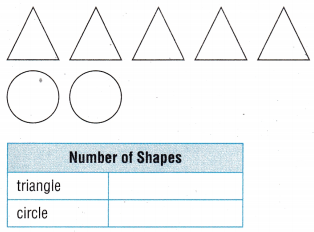
Make Tally Tables Draw tally marks to show the number of each type of shape.
Question 1.
Answer:
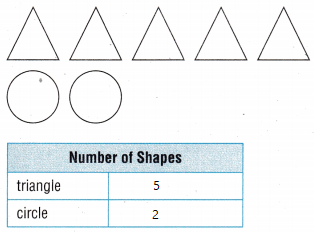
Explanation:
There are 5 triangles and 2 circles
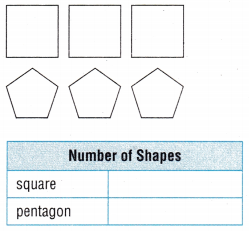
Question 2.
Answer:
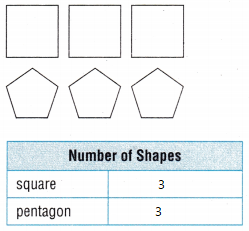
Explanation:
There are 3 squares and 3 pentagons
Use Models to Add Fractions with Like Denominators
Shade the fraction strips to show the addition. Write the sum.
Question 3.
\(\frac{1}{6}+\frac{3}{6}\)
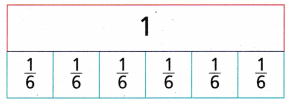
Answer:
\(\frac{1}{6}+\frac{3}{6}\) = \(\frac{4}{10}\)
Explanation:
By using Fraction strip model
If there are like denominators we can directly add numerators
Question 4.
\(\frac{3}{8}+\frac{4}{8}\)
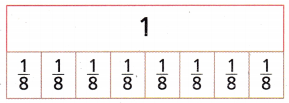
Answer:
\(\frac{3}{8}+\frac{4}{8}\) = \(\frac{7}{8}\)
Explanation:
By using Fraction strip model
If there are like denominators we can directly add numerators
Use Models to Subtract Fractions with Like Denominators
Shade the fraction strips to show the subtraction. Write the difference.
Question 5.
\(\frac{7}{10}-\frac{4}{10}\)
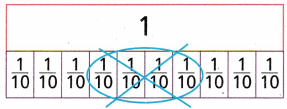
Answer:
\(\frac{7}{10}-\frac{4}{10}\) = \(\frac{3}{10}\)
Explanation:
By using Fraction strip model
If there are like denominators we can directly subtract numerators
Question 6.
\(\frac{5}{6}-\frac{1}{6}\)
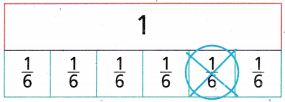
Answer:
\(\frac{5}{6}-\frac{1}{6}\) = \(\frac{4}{6}\)
Explanation:
By using Fraction strip model
If there are like denominators we can directly add numerators
Vocabulary Builder
Review Word
- tally table
Preview Words
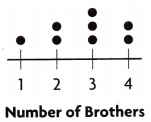
- dot plot
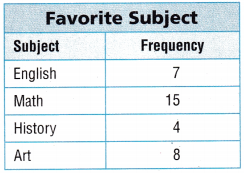
- frequency table
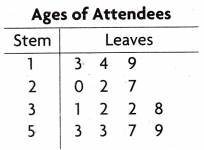
- stem-and-leaf plot
Visualize It.
Write the term next to its example.
Answer:
This is the example of a dot plot
Explanation:
A dot plot, also known as a strip plot or dot chart, is a simple form of data visualization that consists of data points plotted as dots on a graph with an x- and y-axis. These types of charts are used to graphically depict certain data trends or groupings.
Answer:
This as an example of stem and leaf model
Explanation:
Answer:
This is a frequency table
Explanation:
Frequency refers to the number of times an event or a value occurs. A frequency table is a table that lists items and shows the number of times the items occur.
Understand Vocabulary
Complete the sentences by using the review and preview words.
Question 1.
A ______________ uses tally marks to record data.
Answer: Numbers
Explanation:
Numbers are used in a tally chart to record the data
Question 2.
A graph that records each piece of data on a number line is called a ______________.
Answer: Number line
Explanation:
A graph that records each piece of data on a number line is called a Number line
Question 3.
A ______________ is a graph of data arranged by place value.
Answer: Bar graph
Explanation:
A bar graph is a graph of data arranged by place value.
Question 4.
A table that uses numbers to record data about how often something happens is called a ______________.
Answer: Frequency table
Explanation:
A table that uses numbers to record data about how often something happens is called a frequency table.
Reading and Writing Math
Vocabulary
In this unit you will make and solve problems using frequency tables.
Mr. Jackson surveyed his fourth-grade students. He asked, “How much do you spend for lunch each day?” The tally chart shows his data.
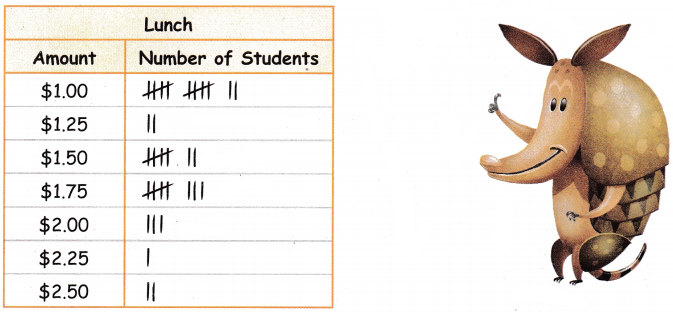
Use the information in the tally chart to answer the questions.
Question 1.
How many students spend $1.75 for lunch?
Answer: 8 students
Explanation:
1 line represent as 1 student
Question 2.
How many more students spend $1.00 for lunch than those that spend $1.25 and $2.00 combined?
Answer:
2 + 3 = 5
students spend $1.00 is 12
12 – 5 = 7
Explanation:
1 line represent as 1 student
Writing Jessica arrived late to class. She told Mr. Jackson she spent $2.25 each day for lunch. Does this change the data in the tally table? Explain.
Answer: Yes,
Explanation:
In the tally table it is showing as 1 student it changes to 2
Reading Check out this book in your library. Tiger Math: Learning to Graph from a Baby Tiger by Ann Whitehead Nagda
Get Ready GAME
Biking Buddies Dot Plot
Object of the Game Represent and interpret data on a dot plot
Materials
- 2 number cubes labeled 4-9
- Number lines labeled 8 through 18
- Pencil or marker
Set Up
Each team gets one number line.
Number of Players: teams of 2 or 3 players
How to play
Question 1.
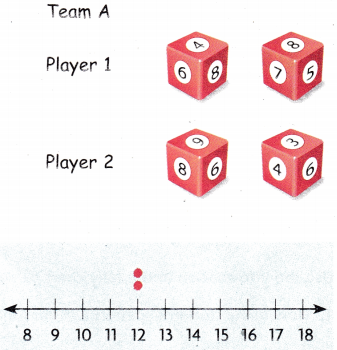
Player 1 on each team tosses the. two number cubes The sum of the numbers tossed is the number of miles you ride your bike that day
Answer:
player 1 travelled 4 + 8 = 12
player 2 travelled 9 + 3 = 12
Question 2.
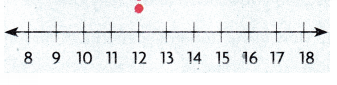
The player records a dot on the number line for the number of miles.
Answer:
player 1 and player 2 scored same points
so, 2 dots are placed at a same point on the number line.
Question 3.
Player 2 on each team tosses the two number cubes, finds the sum, and also plots the number of miles on the team’s dot plot.
Answer:
let us assume that player 2 tossed for 5 and 7
the sum is 12
Question 4.
Repeat the steps until each player on each team has tossed the cubes 7 times.
Answer:
The values are changed according to the cube tosses the player 1 values
2 and 6 = 8
3 and 5 = 8
4 and 5 = 9
9 and 9= 18
7 and 7 = 14
7 and 8 = 15
8 and 8 = 16
Question 5.
Teams analyze their dot plots to find the total number of miles the team rode bikes ¡n one week
Answer:
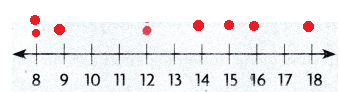
The number of miles are plotted on the dot plot
total of player 1
Question 6.
The team that rode the most number of miles in one week wins the game.
Answer:
The total of player 1 is 91 miles.