Refer to our Texas Go Math Grade 3 Answer Key Pdf to score good marks in the exams. Test yourself by practicing the problems from Texas Go Math Grade 3 Lesson 19.5 Answer Key Dot Plots.
Texas Go Math Grade 3 Lesson 19.5 Answer Key Dot Plots
Unlock the Problem
A dot plot uses dots to record each piece of data above a number line. It helps you see groups in the data.
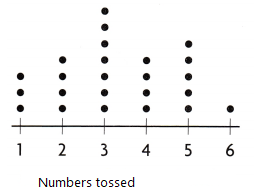
Some students took a survey of the number of letters in their first names. Then they recorded the data in a dot plot.
How many students have 6 letters in their first names?
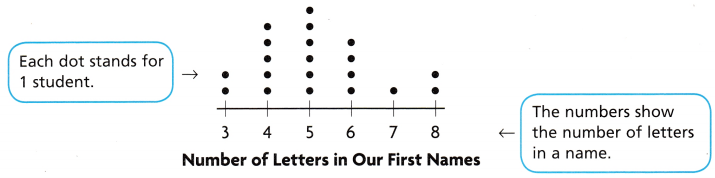
Find 6 on the number line. The 6 stands for 6 _________.
There are _________ dots above the 6.
So, _________ students have 6 letters in their first names.
Answer:
Find 6 on the number line. The 6 stands for 6 Number of letters in a name
There are 4 dots above the 6.
So, 4 students have 6 letters in their first names.
Question 1.
Which number of letters was found most often?
Answer: 5
Explanation:
In the line plot we can see that
There are 6 dots above the 5.
So, 6 students have 5 letters in their first names.
This is most often
Question 2.
Write a sentence to describe the data.
Answer:
Data is shown about the survey of students about their first names
and the number of letters in their names
Question 3.
How many letters are in your first name?
Answer: 5
Explanation:
Most often the first name has 5
Question 4.
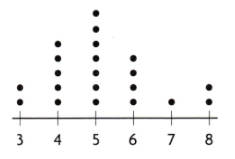
Put a dot above the number of letters in your first name.
Answer:
Explanation:
A dot above the number of letters in my first name is placed
Math Talk
Mathematical Processes
What does the shape of the data show you?
Answer:
As A mountain
Explanation:
The shape of the data show as a mountain in my view
Activity Make a dot plot
Materials; number cube labeled 1 to 6
Each member of your group should toss a number cube 1 time. Combine your data with other groups’ data. Then make a dot plot to show the data you collected.
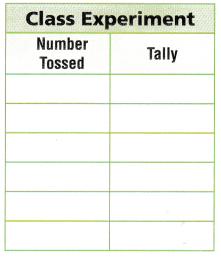
STEP 1:
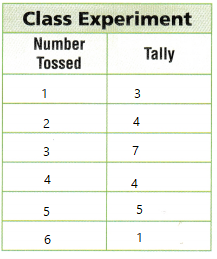
Record the numbers tossed in the table.
STEP 2:
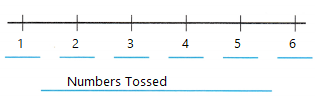
Write a title below the number line to describe your dot plot.
STEP 3:
Write the numbers tossed in order from left to right above the title.
STEP 4:
Draw dots above the number line to show each number tossed.
Answer:
Written a title below the number line to describe my dot plot.
Drawn dots above the number line to show each number tossed.
Share and Show
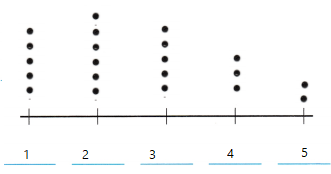
Use the Number of Pets dot plot for 1-3.
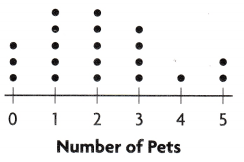
Question 1.
How many students have 1 pet?
Think: How many dots are above 1?
Answer: 5
Explanation:
5 students have 1 pet
Question 2.
What number of pets do 2 students have?
Answer: 5 pets
Explanation:
2 students have 5 pets
Question 3.
Do more students have more than 2 pets or fewer than 2 pets?
Answer: more
Most of the students have 2 pets and more than 2 pets
Problem Solving
Use the table at the right for 4-7.
Question 4.
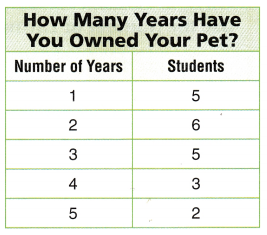
Use the data in the table to make a dot plot.
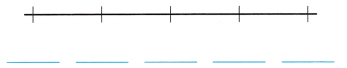
How Many Years Have You Owned Your Pet?
Answer: 1 year
Explanation:
1 year I have owned my pet
Question 5.
How many students have owned a pet for 1 year?
Answer: 5
Explanation:
5 students have owned a pet for 1 year
Question 6.
Analyze Which number of years is found most often?
Answer: 1 , 2 , 3 number of years is found most often
Explanation:
1 , 2 , 3 number of years is found most often
According to line plot
Question 7.
H.O.T. Multi-Step How many more students have owned a pet for 2 years or less than for 3 years or more?
Answer: 16
16 more students have owned a pet for 2 years or less than for 3 years or more
For 8-10, use the Baskets of Blueberries Picked dot plot.
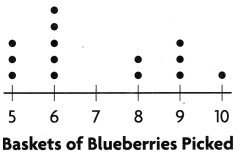
Question 8.
Representations How many people picked 5 baskets of blueberries?
Answer: 3
Explanation:
3 many people picked 5 baskets of blueberries
Question 9.
Multi-Step How many more people picked 6 or fewer baskets of blueberries than picked 8 or more baskets of blueberries?
Answer: 2 people
Explanation:
6 or fewer baskets of blueberries collected by 8 people
8 or more baskets of blueberries collected by 6 people
2 more people picked 6 or fewer baskets of blueberries than picked 8 or more baskets of blueberries
Question 10.
H.O.T. Is there any number of baskets for which there are no data? Explain.
Answer: 7
Explanation:
7 number of baskets for which there are no data
Daily Assessment Task
Fill in the bubble for the correct answer choice. Use the Number of Throws to Win dot plot for 11-14.
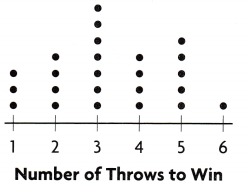
Question 11.
Apply For a penny toss game, players throw a penny into a tank of water and try to get it to land in a small glass. Jim recorded the number of throws it took a group of players to win the penny toss. How many players won on their first try?
(A) 7
(B) 3
(C) 24
(D) 1
Answer: B
Explanation:
Apply For a penny toss game, players throw a penny into a tank of water and try to get it to land in a small glass.
Jim recorded the number of throws it took a group of players to win the penny toss.
3 players won on their first try
Question 12.
Multi-Step How many players needed more than 3 throws to win?
(A) 17
(B) 6
(C) 7
(D) 10
Answer: D
Explanation:
10 players needed more than 3 throws to win
Question 13.
Representations How would you change the dot plot if two more people played the game and each person needed four throws to win?
(A) Draw four dots above 2.
(B) Draw two dots above 4.
(C) Draw two dots above 2.
(D) Draw four dots above 4.
Answer: B
Explanation:
changed the dot plot by drawing 2 dots above 4
Texas Test Prep
Question 14.
Analyze How many more players needed 3 throws to win than 1 throw to win?
(A) 3
(B) 4
(C) 7
(D) 10
Answer: 4
Explanation:
4 more players needed 3 throws to win than 1 throw to win
Texas Go Math Grade 3 Lesson 19.5 Homework and Practice Answer Key
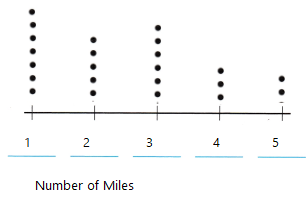
Use the Number of Books Read dot plot for 1-3.
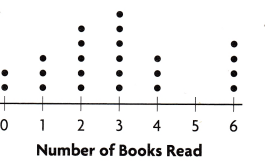
Question 1.
The dot plot shows how many books students read during summer vacation. How many students read 6 books?
Answer: 4
Explanation:
4 students read 6 books
Question 2.
Did more students read more than 2 books or fewer than 2 books?
Answer: more
More students read more than 2 books
Explanation:
5 students read less than 2 books
18 students read more than 2 books
Question 3.
How many students read either 0 books or 5 books?
Answer: Zero
Explanation:
students read either 0 books or 5 books
Problem Solving
Use the table at the right for 4-6.
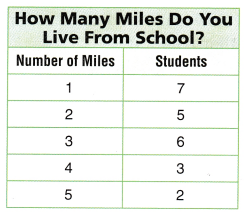
Question 4.
Use the data in the table to make a dot plot.
Explanation:
With the help of frequency table done the dot plot
How Many Miles Do You Live From School?
Answer: 3 miles
Explanation:
3 miles away I leave from school
Question 5.
How many students live less than 2 miles from school?
Answer: 7 students
Explanation:
7 students live less than 2 miles from school
Question 6.
How many students live exactly 4 miles from school?
Answer: 3 students
Explanation:
3 students live exactly 4 miles from school
Lesson Check
Fill in the bubble completely to show your answer. Use the Number of Stolen Bases dot plot for 7-9.
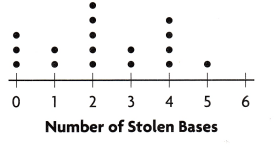
Question 7.
The dot plot shows the number of bases stolen by each player during the softball season. How many players stole a base 5 times?
(A) 1
(B) 5
(C) 2
(D) 3
Answer: 1
Explanation:
1 players stole a base 5 times
Question 8.
Which number of stolen bases is found most often?
(A) 4
(B) 5
(C) 6
(D) 2
Answer: D
Explanation:
2 number of stolen bases is found most often
Question 9.
Multi-Step How many players stole bases during the entire softball season?
(A) 16
(B) 21
(C) 12
(D) 14
Answer: B
Explanation:
21 players stole bases during the entire softball season
Use the Hours Spent Reading dot plot for 10-12.
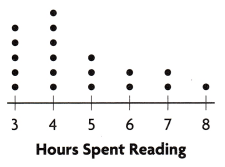
Question 10.
The dot plot shows the number of hours students spent reading in one week. How many students read for more than 6 hours?
(A) 0
(B) 3
(C) 1
(D) 2
Answer: 3
Explanation:
3 students read for more than 6 hours
Question 11.
How would you change the dot plot if one more student read for 6 hours?
(A) Draw 1 dot above 6.
(B) Draw 6 dots above 1.
(C) Draw 1 dot above 1.
(D) Draw 6 dots above 6.
Answer: A
Explanation:
The dot plot if one more student read for 6 hours Drawn 1 dot above 6
Question 12.
Multi-Step How many students spent 4 or more hours reading?
(A) 8
(B) 14
(C) 19
(D) 6
Answer: B
Explanation:
14 students spent 4 or more hours reading