Refer to our Texas Go Math Grade 2 Answer Key Pdf to score good marks in the exams. Test yourself by practicing the problems from Texas Go Math Grade 2 Lesson 19.7 Answer Key Conclusions and Predictions.
Texas Go Math Grade 2 Lesson 19.7 Answer Key Conclusions and Predictions
Essential Question
How can you use data from a graph to draw conclusions and make predictions?
Explanation:
Students must be able to draw conclusions and make predictions based on the information given in a bar graph or pictograph.
Conclusions may be inferred, numerical, written, or comparative.
Predictions may be based on patterns within the data,
show future trends, or compare sets of data.
Explore
Draw to complete the graph. Then use the graph to solve.
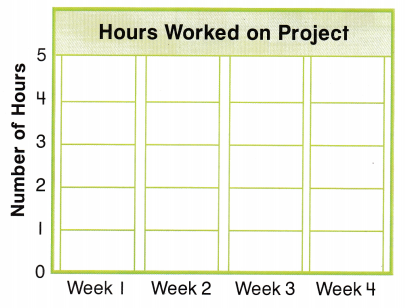
Nathan worked more hours in Week ______ than Week ___.
Explanation:
Nathan worked more hours in Week 4 than Week 3.
Math Talk
Mathematical Processes
Describe how you used the bar graph to solve the problem.
Explanation:
With the help of bar diagram.
Nathan worked more hours in Week 4 than Week 3.
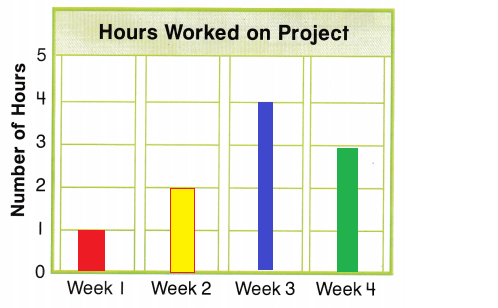
For The Teacher
- Read the following problem. In Week 1, Nathan worked on his project for 1 hour. In Week 2, he worked on his project for 2 hours. In Week 3, he worked on his project for 4 hours. In Week 4, Nathan worked 3 hours on his project. Did Nathan work more hours on his project in Week 3 or Week 4?
Explanation:
Nathan worked more hours on Week 3.
Model and Draw
Use the data to make a conclusion.
Describe the change that the data shows.
Predict. How tall do you think the plant will be in Week 5?
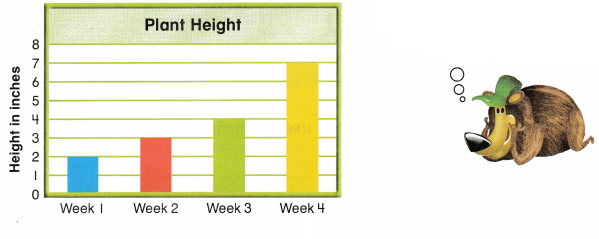
The height of the plant _______
Explanation:
The height of the plant must be 8
Share and Show
Question 1.
Use the graph. Describe the change that the data shows.
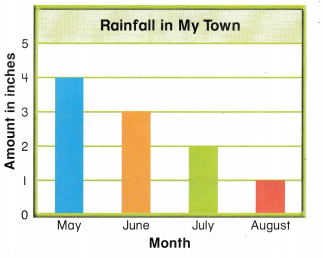
The amount of rainfall _______
Answer:
The amount of rainfall decreases by 1 inch from may to august
Explanation:
According o the graph
The amount of rainfall decreases by 1 inch from may to august
Problem Solving
Use the graph to solve.
Question 2.
H.O.T. Multi-Step Describe the change that the data shows.
The weight of the puppy ___________
Predict. How many pounds will the puppy weigh in Week 5?
___ ponds
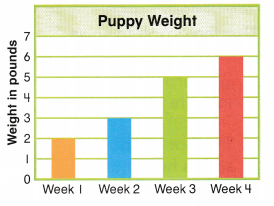

Answer:
The weight of the puppy increases by 1 pound in week 1 and week 2
increases by 2 pounds in week 3 increases by 1 pound in week 4
Explanation:
According to this in week 5 it should increase by 2
puppy weigh in Week 5 might be 7 pounds.
Use the graph to solve.
Question 3.
Bianca is learning to play the guitar. Describe the change that the data shows.
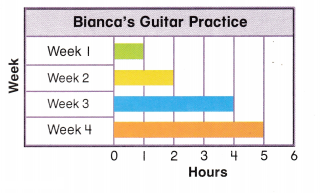
The amount of practice time
Answer:
The amount of practice time increases by 1 hour from week 1 to week 4.
Week 2 to Week 3 the practice time increased 2 hours
Explanation:
Bianca is learning to play the guitar
she increased the practice time
Question 4.
Multi-Step Why do you think the number of hours changed from week to week?
Predict. How many hours might Bianca practice in Week 5? ___ hours
Answer: 2 hours might Bianca practice in Week 5
Explanation:
As the practice time increase the hours change from week to week.
Daily Assessment Task
Use the graph to solve.
Ginger ‘is learning to write poems.
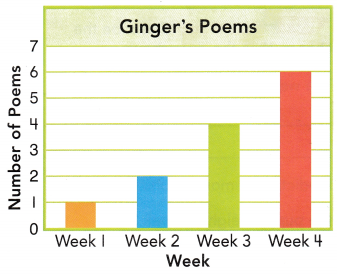
The bar graph shows how many poems she writes for 4 weeks.
Question 5.
Why do you think the number of poems changed from week to week?
Predict. How many poems might Ginger write in Week 5? _______ poems
Answer: 8 poems
Explanation:
Rather than week 1 the remaining weeks she wrote 2 poems per week
so, according to this information Ginger must write 2 poems in week 5.
Question 6.
Texas Test Prep Use the bar graph above.
Which describes the change that the data shows?
(A) The number of poems decreases.
(B) The number of poems stays the same.
(C) The number of poems increases.
Answer: C
Explanation:
The number of poems increased by 2 week to week
Texas Go Math Grade 2 Lesson 19.7 Homework and Practice Answer Key
Question 1.
Use the graph to solve. Describe the change that the data shows.
The amount of snowfall _____
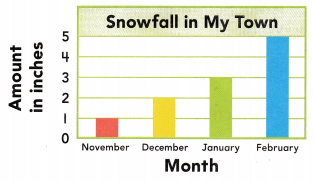
Answer:
The amount of snowfall Increased
Explanation:
According to the graph
The snow fall is increased by 2 inches from January to February.
Problem Solving
Use the graph to solve.
Question 2.
Multi-Step Jonathan is learning to play the piano. Describe the change that the data shows.
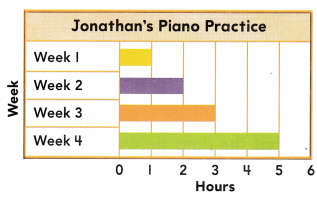
The amount of practicing time
Answer:
The amount of practicing time increasing from week to Week
Explanation:
Jonathan is learning to play the piano.
He increased the practice by 2 hours from week 3 to week 4
Texas Test Prep
Lesson Check
Choose the correct answer.
Question 3.
Eddie measured the growth of the flower for 4 weeks. What is the height of the flower at Week 3?
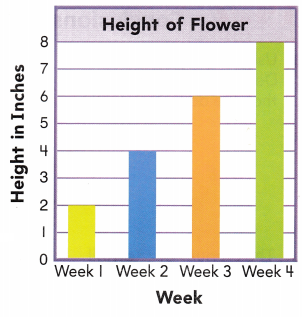
(A) 8 inches
(B) 4 inches
(C) 6 inches
Answer: C
Explanation:
The height of the flower at Week 3 is 6 inches
Question 4.
Eddie predicts the height at Week 5. Which is the best prediction?
(A) 6 inches
(B) 9 inches
(C) 1 inches
Answer: B
Explanation:
According to the graph the flower is growing but not decreasing
so, Eddie predicts the height at Week 5 as 9.
Question 5.
Which describes the change that the data shows?
(A) The height of the flower increases.
(B) The height of the flower stays the same.
(C) The height of the flower decreases.
Answer: A
Explanation:
The height of the flower increases by 2 inches from week to week.