Refer to our Texas Go Math Grade 2 Answer Key Pdf to score good marks in the exams. Test yourself by practicing the problems from Texas Go Math Grade 2 Lesson 19.5 Answer Key Use Data to Write Problems.
Texas Go Math Grade 2 Lesson 19.5 Answer Key Use Data to Write Problems
Essential Question
How can you write and solve a problem about data in a graph?
Explanation:
- Understand the Problem.
- Devise a Plan—Translate: Make a graph.
- Carry Out the Plan—Solve: Use the graph to answer the question asked.
- Look—Check and Interpret.
Explore
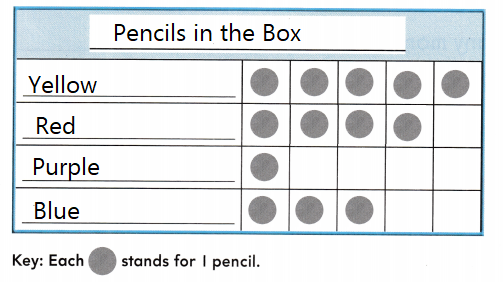
Use the data to make a pictograph.
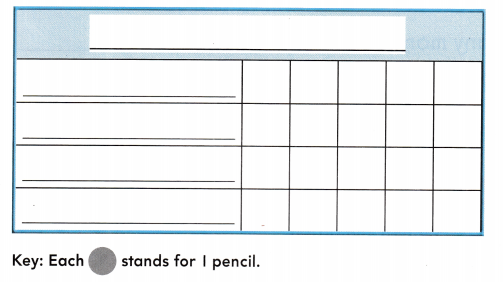
For The Teacher Read the following problem. The teacher has 5 yellow pencils in a box. She has 4 red pencils in the box. She has 1 purple pencil in the box. She has 3 blue pencils in the box. How many fewer purple pencils than red pencils are there in the box?
Math talk
Mathematical Processes
Explain how you used the graph to answer question.
The data in the bar graph shows the information
Model and Draw
What story problems could you ask about the data?
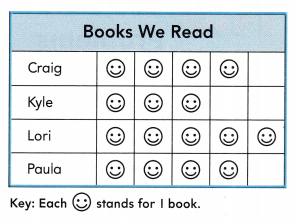
Four children read some books. How many books did Craig and Kyle read?
Answer: ___ books
7 books
Explanation:
Craig read 4 books
and Kyle read 3 books
How many more books did _______
read than _____________ ?
Answer: ___ more books
Explanation: 1 more books
How many more books did Lori read than Paula
5 – 4 = 1
1 more book Lori read than Paula
Share and Show
Write a question that the graph could be used to solve. Then solve.
Question 1.
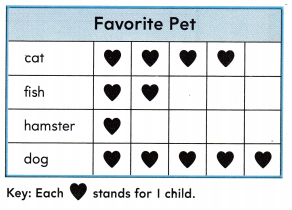
Children voted for their favorite pet.
Answer:
Total children voted for their favorite pet is 12
Explanation:
How many Children voted more chose dog than the fish
Children chose dog is 5
Children chose fish is 2
5 – 2 = 3
3 more children voted dog than fish
Problem Solving
Write a question that the graph ‘could be used to solve. Then solve.
Question 2.
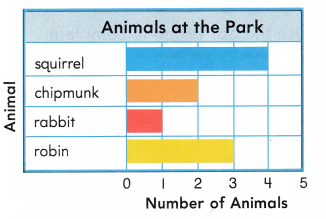
We saw these animals at the park.
Answer: Squirrels, Chipmunk, Rabbit, Robin
are the animals which we see in the park
Question 3.
Multi-Step Write a question about the data ¡n the graph above that you could use this addition sentence to solve.
Answer: Kate went to see the animals to zoo he saw Chipmunk and Robin. How many did Kate see altogether
Number of chipmunk are 3
Number of robins are 2
3 + 2 = 5
Question 4.
H.O.T. Look at the bars in the bar graph. What do you know about the data just by looking at the different lengths of bars?
Answer: Number of animals in the park
Are there in the park.
The data is about the number of animals in the park
Daily Assessment Task
Use the bar graph to complete.
Question 5.
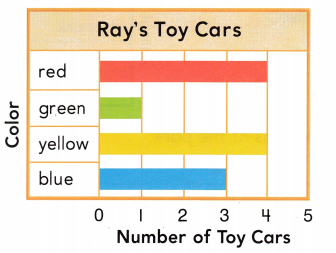
Use the data in the bar graph. Write a problem that you would use addition or subtraction to solve. Then solve. Ray has these toy cars.
Answer:
Ray has 4 red cars and 3 blue cars
how many did he have altogether
Explanation:
4 + 3 = 7
Ray has 7 cars altogether.
Question 6.
Texas Test Prep Use the bar graph above. Which question could you use the bar graph to solve?
(A) How many cars are the same size?
(B) How many toy cars does Ray have?
(C) Who has more red cars than Ray?
Answer: B
Explanation:
How many toy cars does Ray have?
the bar graph shows about the above information.
Texas Go Math Grade 2 Lesson 19.5 Homework and Practice Answer Key
Write a question that the graph could be used to solve. Then solve.
Question 1.
Mia picked these flowers.
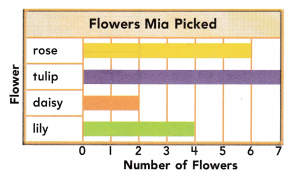
Answer: _______________________
Rose, Tulip, Daisy, Lily
Explanation:
Rose, Tulip, Daisy, Lily are the 4 types of flowers that
Mia picked.
Problem Solving
Use the bar graph above.
Question 2.
Multi-Step Write a question that you could use this addition sentence to solve.
Answer: Mia picked some lily and some tulip. What the Mia pick altogether.
Explanation:
Lily are 4 and Tulip are 7
4 + 7 = 11
Mia pick 11 flowers altogether.
Question 3.
Multi-Step Look at the bars in the bar graph. What do you know about the data just by looking at the different lengths of bars?
Answer: Number of flowers picked up by Mia
Explanation:
We know about the data just by looking at the different lengths of bars is Flowers picked up by Mia.
Texas Test Prep
Lesson Check
Choose the correct answer.
Question 4.
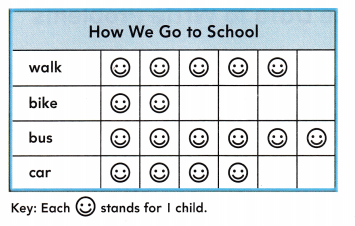
Adam walks to school. How many other children walk to school?
(A) 2
(B) 4
(C) 3
Answer: A
Explanation:
4 other children walk to school. According to bar graph.
Question 5.
Beth goes to school the way most of the other children go to school. How does she go to school?
(A) walk
(B) bike
(C) bus
Answer: C
Explanation:
The way most of the other children go to school is by bus.
So, Beth also goes to school by bus.
Question 6.
Which question could you use the pictograph to answer?
(A) Which children get to school by car?
(B) How many more children would like to walk to school?
(C) How many children bike to school?
Answer: B
Explanation:
5 more children like to go to school by walk.