Refer to our Texas Go Math Grade 2 Answer Key Pdf to score good marks in the exams. Test yourself by practicing the problems from Texas Go Math Grade 2 Lesson 19.4 Answer Key Make Bar Graphs.
Texas Go Math Grade 2 Lesson 19.4 Answer Key Make Bar Graphs
Essential Question
How ’do you make a bar graph to show data?
Explanation:
A bar graph is a graph that shows complete data with rectangular bars and the heights of bars are proportional to the values that they represent.
Explore
Use the bar graph to solve the problem. Draw or write to show what you did.
__ writing tools
For The Teacher
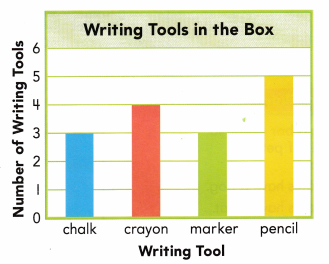
- Read the following problem. Barry made this bar graph, How many writing tools are in the box’
Explanation:
4 writing tools
according to the bar graph.
Math Talk
Mathematical processes
What do the lengths of the bars in the graph show for crayon and marker? Explain.
Explanation:
crayon = 4
and marker = 3 the lengths of the bars in the graph
Model and Draw
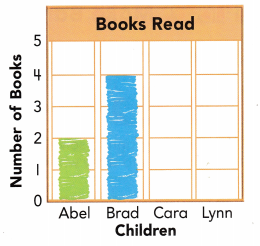
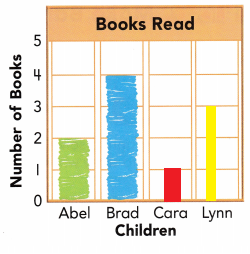
Complete the bar graph to show this data.
- Abel read 2 books.
- Brad read 4 books.
- Cara read I book.
- Lynn read 3 books.
Explanation:
Explanation:
Bar graph is done with the help of the data.
Share and Show
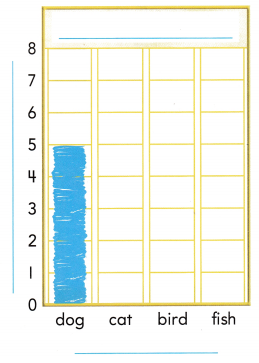
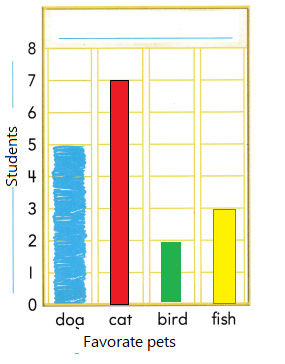
Ella is making a bar graph to show the kinds of pets her classmates have.
- 5 classmates have a dog.
- 7 classmates have a cat.
- 2 classmates have a bird.
- 3 classmates have fish.
Explanation:
Question 1.
Write labels and draw bars to complete the graph.
Answer:
Explanation:
Written the labels and completed the bar graph.
Question 2.
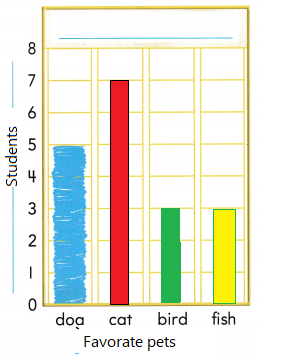
How will the graph change if one more child gets a bird?
Answer:
Explanation:
The graph of the bird will increase to 3
2 + 1 = 3
Problem Solving
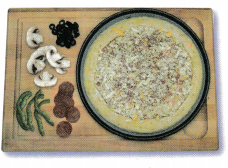
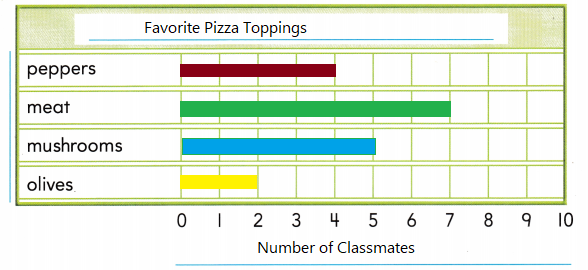
Dexter asked his classmates which pizza topping is their favorite.
- 4 classmates chose peppers.
- 7 classmates chose meat.
- 5 classmates chose mushrooms.
- 2 classmates chose olives.
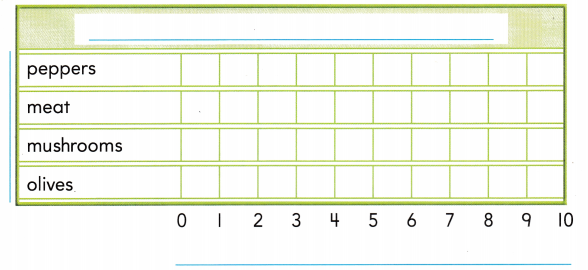
Question 3.
Write a title and labels for the bar graph. Draw bars to show the data.
Answer:
Explanation:
Completed the graph and written the labels.
Question 4.
Multi-Step Did more classmates choose peppers and olives than meat? Explain.
Answer:
4 classmates chose peppers.
2 classmates chose olives.
4 + 2 = 6
7 classmates chose meat.
7 > 6
Yes, classmates choose peppers and olives than meat.
Question 5.
H.O.T. Multi-Step Which three toppings were chosen by a total of 13 children?
Answer: meet. olives. and peppers.
Explanation:
7 classmates chose meat.
2 classmates chose olives.
4 classmates chose peppers.
7 + 2 + 4 = 13
Daily Assessment Task
Follow the directions.
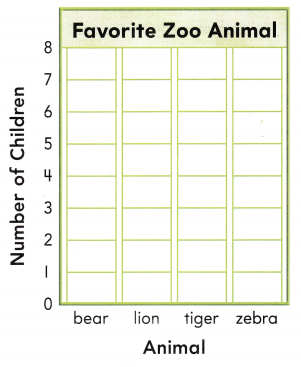
Question 6.
Draw bars in the graph to show this data. 6 children chose bear. 4 children chose lion. 7 children chose tiger. 3 children chose zebra.
Answer:
Explanation:
A bar graph is completed with the help of data.
Choose the correct answer.
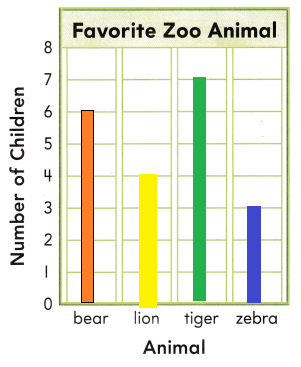
Question 7.
Analyze How many children voted for their favorite zoo animal?
(A) 20
(B) 8
(C) 16
Answer: A
Explanation:
20 children voted for their favorite zoo animal.
Question 8.
Texas Test Prep Look at the bar graph above. Which animal did the most children choose?
(A) bear
(B) Tiger
(C) zebra
Answer: B
Explanation:
The most children chose Tiger as there favorite Zoo animal
Texas Go Math Grade 2 Lesson 19.4 Homework and Practice Answer Key
Make Bar Graphs
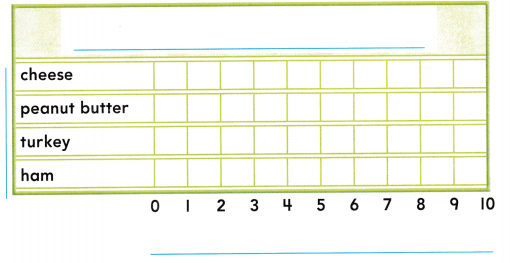
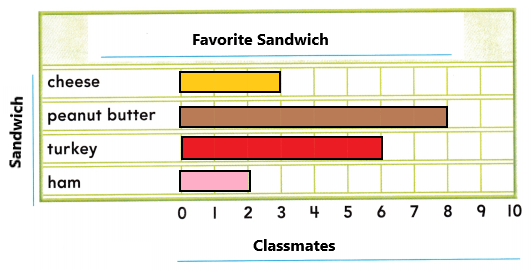
Andy asked his classmates which sandwich is their favorite.
- 3 classmates chose cheese.
- 8 classmates chose peanut butter.
- 6 classmates chose turkey.
- 2 classmates chose ham.
Question 1.
Write a title and labels for the bar graph. Draw bars to show the data.
Answer:
Explanation:
Written the title and labels for the bar graph as we can observe in the above image. A bar graph is completed with the help of data.
Problem Solving
Question 2.
Multi-Step Did more children choose cheese or ham than turkey? Explain.
Answer:
6 classmates chose Turkey.
3 classmates choose Cheese.
3 < 6
2 classmates choose Ham.
2 < 6
No, classmates doesn’t choose Cheese or ham than Turkey.
Texas Test Prep
Lesson Check
Choose the correct answer.
Question 3.
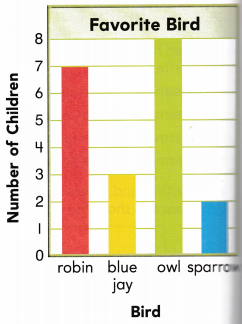
Which bird did most children choose?
(A) robin
(B) owl
(C) blue jay
Answer:
The most children choose owl.
So, option B is correct.
Explanation:
In the favorite bird bar graph we can observe that 8 children choose owl. So, draw a circle for option B.
Question 4.
Sydney chose the bird that got fewer votes than blue jay. Which bird did Sydney choose?
(A) robin
(B) owl
(C) sparrow
Answer:
Option C is correct.
Explanation:
In the favorite bird bar graph we can observe that 3 children voted for Blue jay and 2 children voted for Sparrow. Sydney chose the sparrow that got fewer votes than blue jay. So, draw a circle for option C.
Question 5.
Matt chose the bird that got 5 more votes than sparrows. Which bird did Matt choose?
(A) owl
(B) robin
(C) blue jay
Answer:

Option B is correct.
Explanation:
In the favorite bird bar graph we can observe that 7 children voted for Robin and 2 children voted for Sparrow. Matt chose the robin that got five more votes than sparrows. So, draw a circle for option B.
Question 6.
Multi-Step How many children voted for their favorite bird?
(A) 20
(B) 15
(C) 17
Answer:

Option A is correct.
Explanation:
7 children voted for Robin.
3 children voted for Blue jay.
8 children voted for owl.
2 children voted for Sparrow.
7 + 3 + 8 + 2 = 20
20 children voted for their favorite bird. So, draw a circle for option A.