Refer to our Texas Go Math Grade 1 Answer Key Pdf to score good marks in the exams. Test yourself by practicing the problems from Texas Go Math Grade 1 Unit 5 Assessment Answer Key.
Texas Go Math Grade 1 Unit 5 Assessment Answer Key
Vocabulary
Question 1.
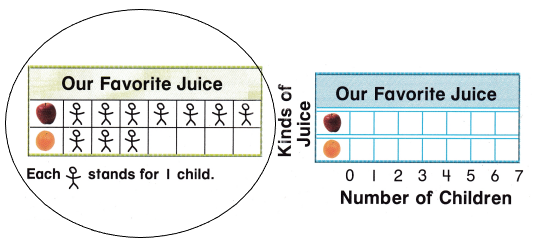
Circle the picture graph. (p.660)
Answer:
Explanation:
A graph that represents the data in the form of pictures is a picture graph.So, I drew a circle around the picture graph.
Question 2.
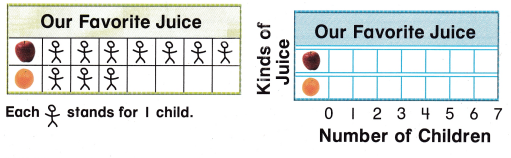
Use the picture graph to complete the bar graph. (p.672)
Answer:
Explanation:
I completed the bar graphs using the values drwan from picture graph.
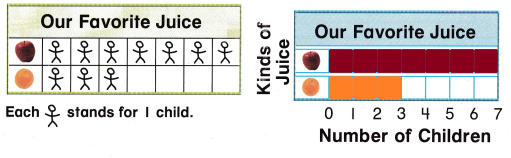
7 children like apple juice and 3 children like orange juice.
Concepts and Skills
Use the graphs above to answer the questions, (TEKS 1.8.C)
Question 3.
Use the picture graph to write a question.
Answer:
How many children like apple juice?
Question 4.
Use the bar graph to write a question.
Answer:
How many children like orange juice?
Question 5.
How many more children chose ![]() than
than ![]() ?
?
___________ more children
Answer:
4 more children
Explanation:
7 children like apple juice
3 children like orange juice
7-3=4
So, 4 more children chose ![]() than
than ![]() .
.
Question 6.
Which juice did more children choose? Circle it.
Answer:
Explanation:
I drew a circle around apple as most of the children chose apple juice as their favourite.
Choose the correct answer.
Question 7.
How many children chose soccer? (TEKS 1.8.A)
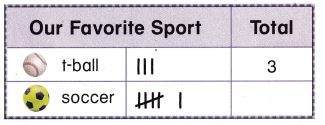
(A) 3
(B) 6
(C) 4
Answer:
(B) 6
Explanation:
The tally mark beside soccer ball represent the number 6.So, 6 children chose soccer as their favourite sport.
Question 8.
Which snack did the most children choose? (TEKS 1.8.A)
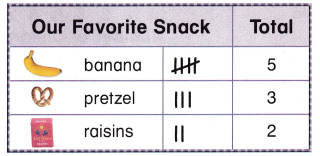
(A) 
(B) 
(C) ![]()
Answer:
(A)
Explanation:
5 ot of 10 children chose banana as their favourite snack.So,is the most liked snack.
Question 9.
How many children chose ![]() ? (TEKS 1.8.A)
? (TEKS 1.8.A)
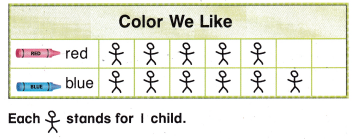
(A) 6 children
(B) 3 children
(C) 5 children
Answer:
(C) 5 children
Explanation:
5 children chose the color red.
Choose the correct answer
Question 10.
How many more days this month had ![]() than
than ![]() ? (TEKS 1.8.C)
? (TEKS 1.8.C)
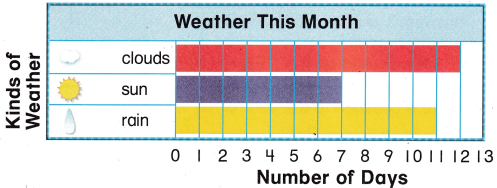
Answer:
(A) 5 more days
(B) 4 more days
(C) 11 more days
Answer:
(B) 4 more days
Explanation:
11 days in this month had rain
7 days in this month has sun
11-7=4
So, 4 more days this month had ![]() than
than ![]() .
.
Question 11.
Sam makes a tally chart to show how many cars and trucks he has. Which group of tally marks shows how many cars Sam has? (TEKS 1.8.C)
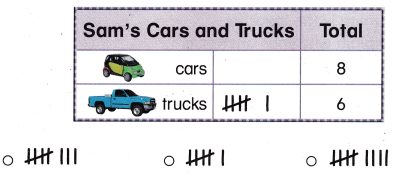
Answer:
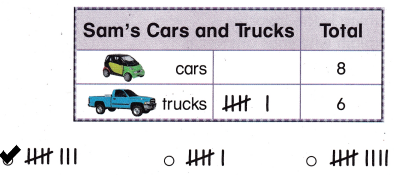
Explanation:
I marked the option that shows the tally mark 8.
Choose the correct answer.
Question 12.
Use the T-chart about children that do wear glasses or do not wear glasses to answer the question, (TEKS 1.8.A)
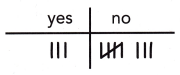
How many fewer children answered yes than no?
(A) 8 fewer children
(B) 3 fewer children
(C) 5 fewer children
Answer:
(C) 5 fewer children
Explanation:
3 children answered yes
8 children answered no
8-3=5
Therefore, 5 fewer children answered yes than no.
Question 13.
Write a question to ask your class.
- Ask 10 children your question.
- Record the information in a T-chart or a tally chart.
- Show the same information in a picture graph or a bar graph.
Use numbers, pictures, or words to tell which thing is the favorite. Justify. Explain why your answer is reasonable. (TEKS 1.8.A, 1.8.B, 1.8.C)
Answer:
Question:
Which flavour did most of the children chose?
Answer:
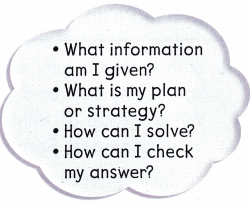
The information i gave is
Chose your favourite icecream flavour from vanila and chocolate.
My plan is to t-chart
I can solve the problem by representing the information in form of bar graph.
I can check my answer by using the chart.
Explanation:
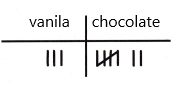
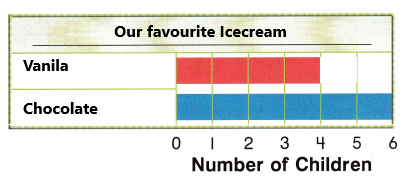
4 children chose vanila
6 children chose chocolate
6 is morethan
Most children liked chocolate icecream.