Refer to our Texas Go Math Grade 1 Answer Key Pdf to score good marks in the exams. Test yourself by practicing the problems from Texas Go Math Grade 1 Lesson 19.7 Answer Key Represent Data.
Texas Go Math Grade 1 Lesson 19.7 Answer Key Represent Data
Unlock the Problem
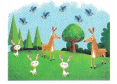
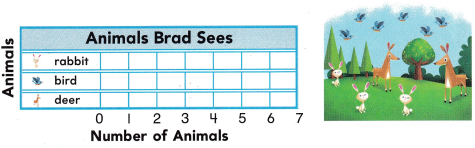
Brad sees many animals at the park. How can you find how many animals Brad sees?
Answer:
Read
What information am I given?
the number of rabbits, birds, and deer in the picture
Plan
What is my plan or strategy?
I can _______________
Solve
Show how you solve the problem.
__________ + __________ + __________ = ___________ animals
Answer:
Explanation:
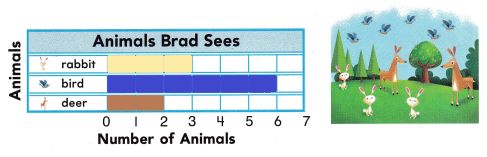
There are 3+6+2=11 animals at the park.
HOME CONNECTION • Your child learned how to represent data from a picture in a bar graph. Have your child explain why it is easier to use data in a bar graph than in a picture.
Answer:
It is easier to use data in a bar graph than in a picture as i count and compare easily.
Try Another Problem
Make a graph to solve.
- What information am I given?
- What is my plan or strategy?
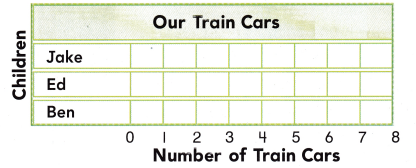
Question 1.
Jake has 4 more train cars than Ed. Ed has 3 train cars. Ben has 2 fewer train cars than Ed. How many train cars does Jake have?

________ train cars
Answer:
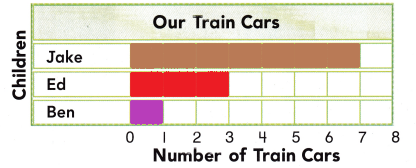
Explanation:
Ed has 3 train cars,
Ben has 1 train car
jake has 7 train cars.
Question 2.
Marla has 8 dolls. Three dolls have blue eyes. The rest have brown. How many dolls have brown eyes?
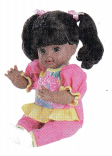
_________ dolls
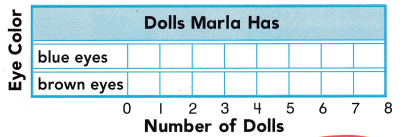
Answer:
Explanation:
Marla has 8 dolls
3 dolls have blue eyes
8-3=5
Therefore, 5 dolls have brown eyes.
Math Talk
Mathematical Processes
Describe how the bar graph helps you solve Exercise 2.
Answer:
If i mark the 3 dolls with blue eyes then out of 8 the rest of the 5 dolls will have brown eyes.So, Bar graph helped me to find the number of dolls with brown eyes easily.
Share and Show
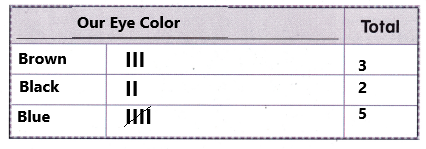
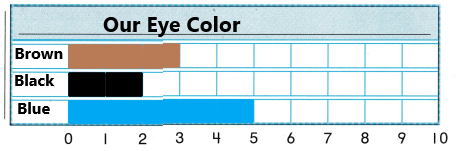
Find out about the eye color of your classmates.
Question 3.
Write a question you can ask your friends.
Answer:
Which color eyes do most of the children have?
Question 4.
Ask 10 friends your question. Make a tally chart.
Collect data.
Answer:
Problem Solving
Question 5.
H.O.T. Multi-Step Use the tally chart in Exercise 4 to make a bar graph.
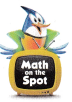
Answer:
Question 6.
H.O.T. Multi-Step Use the bar graph to write a question. Then solve it.
Answer:
5 children out of 10 have blue eyes.
So, most of the children have blue eyes.
Daily Assessment Task
Choose the correct answer.
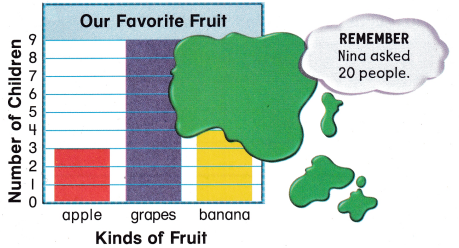
What is your favorite fruit? Nina asked 20 children this question. Then she made a bar graph. But Nina spilled paint on the graph.
Question 7.
How many children chose grapes?
(A) 3
(B) 9
(C) 8
Answer:
(B) 9
Explanation:
Nina asked 20 children what is their favourite fruit. Then she made a bar graph.
9 children chosed grapes.
Question 8.
Use Graphs How many children chose banana?
(A) 8
(B) 9
(C) 3
Answer:
(A) 8
Explanation:
Nina asked 20 children what is their favourite fruit.
3 children chose apples
9 children chose grapes
20-9-3=8
Therefore, 8 children chose banana.
Question 9.
Texas Test Prep Use the bar graph at the top. How many more children chose grapes than apple?
(A) 3 more children
(B) 6 more children
(C) 9 more children
Answer:
(B) 6 more children
Explanation:
3 children chose apples
9 children chose grapes
9-3=6
So, 6 more children chose grapes than apples.
TAKE HOME ACTIVITY • Work with your child to make a tally chart and a bar graph showing the favorite color of 10 family members or friends. Talk about the results.
Answer:
Texas Go Math Grade 1 Lesson 19.7 Homework and Practice Answer Key
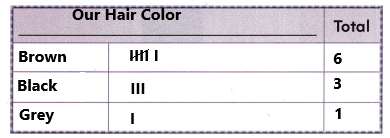
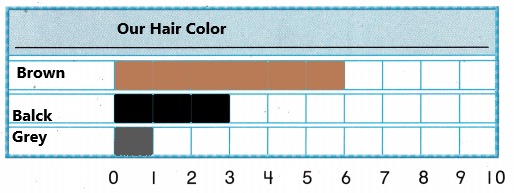
Find out about the hair color of some friends.
Question 1.
Write a question you can ask your friends.
Answer:
What is the color of your hair?
Question 2.
Ask 10 friends your question. Make a tally chart.
Answer:
Problem Solving
Multi-Step Use the tally chart to make a bar graph.
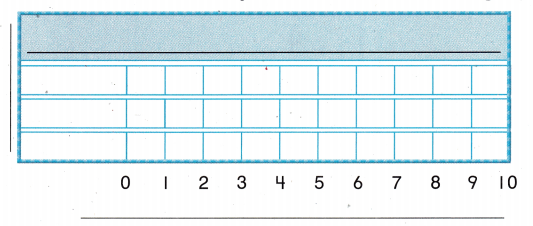
Answer:
Question 3.
Use the bar graph to write a question.
Answer:
Which hair color is chosed by most of the children?
Lesson Check
Choose the correct answer.
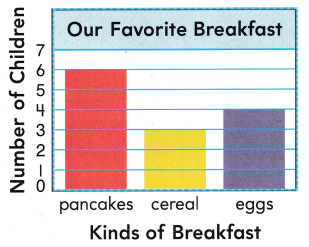
What is your favorite breakfast? Lily asked some friends this question. Then she made a bar graph.
Question 4.
How many children chose pancakes?
(A) 7
(B) 4
(C) 6
Answer:
(C) 6
Explanation:
6 children chose pancakes as thier favourite breakfast.
Question 5.
How many children chose eggs?
(A) 6
(B) 4
(C) 3
Answer:
(B) 4
Explanation:
4 children chose eggs as thier favourite breakfast.
Question 6.
How many fewer children chose cereal than pancakes?
(A) 3
(B) 2
(C) 4
Answer:
(A) 3
Explanation:
6 children chose pancakes
3 children chose cereal
6-3=3
Therefore, 3 fewer children chose cereal than pancakes.