Practice questions available in McGraw Hill Math Grade 6 Answer Key PDF Lesson 25.5 Venn Diagrams will engage students and is a great way of informal assessment.
McGraw-Hill Math Grade 6 Answer Key Lesson 25.5 Venn Diagrams
Exercises
INTERPRET
Question 1.
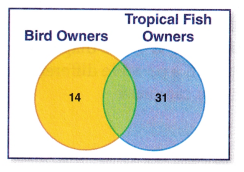
In a survey of 75 pet owners, 14 people owned pet birds and 31 owned tropical fish. The remaining people owned both a pet bird and tropical fish. What number should be placed in the intersecting area of the diagram?
Answer:
Given,
In a survey of 75 pet owners, 14 people owned pet birds and 31 owned tropical fish.
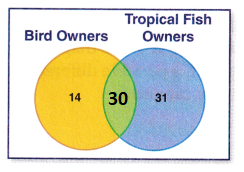
75 – 14 – 31 = 30
So, 30 should be placed in the intersecting area of the diagram.
Question 2.
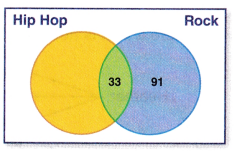
200 students at Edgewater Middle School were surveyed about their favorite type of music. Every student listened to either Hip Hop or Rock music. Some listened to both. Examine the Venn Diagram and calculate how many students listen only to Hip Hop.
Answer:
Given,
200 students at Edgewater Middle School were surveyed about their favorite type of music.
Number of students listen to rock music = 91
Every student listened to either Hip Hop or Rock music = 33
200 – 91 – 33 = 76
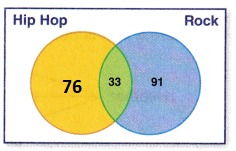
Thus 76 students listen only to Hip Hop.
Question 3.
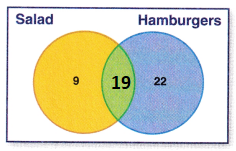
In a survey, 50 students filled out food preferences. What number should be be placed in the intersecting area?
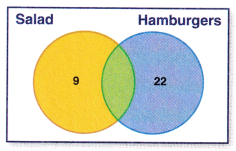
Answer:
In a survey, 50 students filled out food preferences.
50 – 22 – 9 = 19
So, 19 students should be placed in the intersecting area.
Question 4.
This Venn Diagram shows data about gum preferences. How many people participated in the survey?
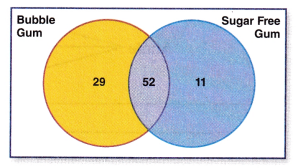
Answer:
People preferred bubble gum = 29
People preferred Sugar free gum = 11
People preferred both bubble gum and Sugar-free gum = 52
29 + 11 + 52 = 92
Thus 92 people participated in the survey