Practice questions available in McGraw Hill Math Grade 6 Answer Key PDF Lesson 25.3 Box-and-Whisker Plots will engage students and is a great way of informal assessment.
McGraw-Hill Math Grade 6 Answer Key Lesson 25.3 Box-and-Whisker Plots
Exercises
SOLVE
Question 1.
What is the approximate median of the data in the box-and-whisker plot?
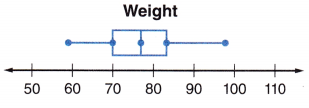
Answer:
A box and whisker plot is defined as a graphical method of displaying variation in a set of data.
From the above plot, we can say that the median is 75.
Question 2.
The middle 50% of the data is between what two values?
Answer:
The minimum value is 65
Maximum value is 100
First Quartile Q1 = 73.5
Third Quartile Q3 = 91.25
Q3 – Q1 = 91.25 – 73.5 = 17.75
Question 3.
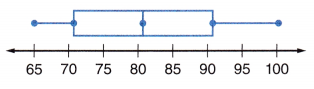
What is the range of the data in the box-and-whisker plot?
Answer:
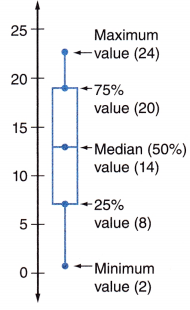
Highest value = 20
Lowest value = 5
Range = 20 – 5 = 15
The range of the data in the box-and-whisker plot is 15.
Question 4.
What is the approximate range of the lowest 25% of the data in the box-and-whisker plot?
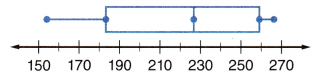
Answer:
The left whisker represents the bottom 25% of the data.
So, 152 is the lowest 25% of the data in the box-and-whisker plot.
Question 5.
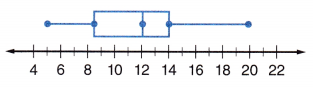
What is the range of the top 75% of the scores in the box-and-whisker plot?
Range: ___________
Answer:
Q3 is the upper quartile that represents the top 75% of the scores in the box-and-whisker plot.
Range = 20 – 2
Range = 18
So, 18 is the range of the top 75% of the scores in the box-and-whisker plot
Question 6.
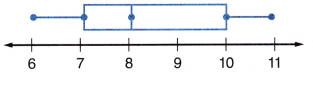
What is the range and median of the box and-whisker plot?
Range: ___________
Median: ____________
Answer:
Range = Highest – Lowest
Range = 11 – 6
Range = 5
The median divides the data set into two sets.
So, 8 is the median of the box and-whisker plot.
Question 7.
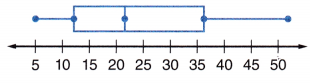
What is the approximate range of the third quartile?
Answer:
The third Quartile is the upper quartile (Q3) = 12.
Question 8.
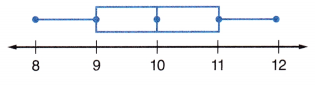
What can you determine about the different quartiles in the box-and-whisker plot?
Answer:
The first step in constructing a box-and-whisker plot is to first find the median (Q2), the lower quartile (Q1) and the upper quartile (Q3) of a given set of data.
You are now ready to find the interquartile range (IQR).
The interquartile range is the difference between the upper quartile and the lower quartile.
IQR = 11 – 9 = 2
Question 9.
What can you say about a student who weighs 155 lbs, if he is part of the group below?
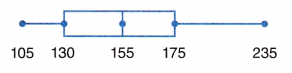
Answer:
155 is the median of the box and-whisker plot.
Question 10.
What is the median of the box-and-whisker plot?
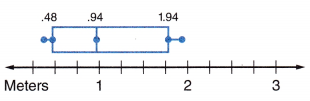
Answer:
Q2 = 0.94
Q2 represents the median of the box-and-whisker plot.
So, 0.94 is the median of the box-and-whisker plot.