Go Math Grade 1 Chapter 10 Answer Key Pdf: Go Math First Grade Chapter 10 Represent Data Answer Key is built to be flexible in today’s learning environment. Downloadable HMH Go Math Grade 1 Ch 10 Represent Data Solutions PDF Files makes it easy for you to use these resources anywhere and anytime you need. Practice using the Go Math Grade 1 Answer Key Chapter 10 Represent Data and get a good hold of the concepts. Access the Topicwise Go Math Grade 1 Ch 10 Represent Data Answers provided via quick links without paying a single penny.
Represent Data Go Math Grade 1 Chapter 10 Answer Key Pdf
Problems provided in the Go Math 1st Grade Ch 10 Represent Data covers questions from Extra Practice, Lessons, Chapter Tests, Homework & Practice, Review Tests, etc. Elaborate Solutions provided in the First Grade Go Math Chapter 10 Answer Key are written in a simple and easy-to-understand language. Begin your practice taking the help of these quick resources available. Solving the Questions available frequently you can attempt the actual exam with utmost confidence and thereby score higher grades.
Represent Data
- Represent Data Show What You Know – Page 572
- Represent Data Vocabulary Builder – Page 573
- Represent Data Game Graph Game – Page 574
- Represent Data Vocabulary Game – Page(574A-574B)
Lesson: 1 Read Picture Graphs
- Lesson 10.1 Read Picture Graphs – Page(575-580)
- Read Picture Graphs Homework & Practice 10.1 – Page(579-580)
Lesson: 2 Make Picture Graphs
- Lesson 10.2 Make Picture Graphs – Page(581-586)
- Make Picture Graphs Homework & Practice 10.2 – Page(585-586)
Lesson: 3 Read Bar Graphs
- Lesson 10.3 Read Bar Graphs – Page(587-592)
- Read Bar Graphs Homework & Practice 10.3 – Page(591-592)
Lesson: 4 Make Bar Graphs
- Lesson 10.4 Make Bar Graphs – Page(593-598)
- Make Bar Graphs Homework & Practice 10.4 – Page(597-598)
Mid-Chapter Checkpoint
Lesson: 5 Read Tally Charts
- Lesson 10.5 Read Tally Charts – Page(599-604)
- Read Tally Charts Homework & Practice 10.5 – Page(603-604)
Lesson: 6 Make Tally Charts
- Lesson 10.6 Make Tally Charts – Page(605-610)
- Make Tally Charts Homework & Practice 10.6 – Page(609-610)
Lesson: 7 Problem Solving • Represent Data
- Lesson 10.7 Problem Solving • Represent Data – Page(611-616)
- Problem Solving • Represent Data Homework & Practice 10.7 – Page(615-616)
- Represent Data Review/Test – Page(617-620)
Represent Data Show What You Know
Make a Concrete Graph
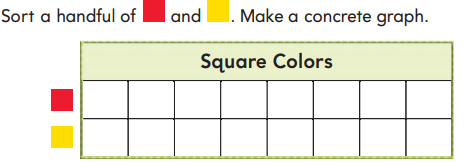
Question 1.
How many ☐ are there? ______
Answer:
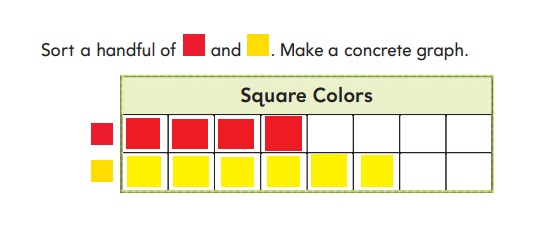
There are 10 ☐
Explanation :
Number of red ☐ = 4
Number of Yellow ☐ = 6
Total Number of ☐ = 4 + 6 = 10 ☐ .
More, Fewer
Question 2.
Shade to show a set of fewer.

Answer:

Number of cars fewer in second row than first row = 2
Explanation:
Number of cars in first row = 4
Number of cars in second row = 2
Number of cars fewer in second row than first row = 4 – 2 = 2
Draw Equal Groups
Question 3.
Draw a 〇 below each picture to show the same number of objects.

Answer:

Explanation :
Number of flowers in first row =3
Number of flowers in second row = 3
Number of flowers in first = Number of flowers in second row = 3
Represent Data Vocabulary Builder
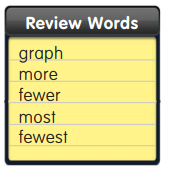
Visualize It
Complete the chart.
Mark each row with a ✔.
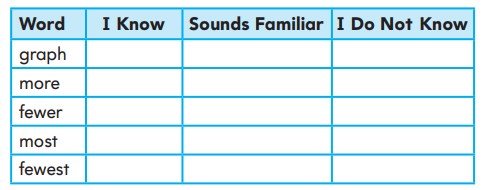
Answer :
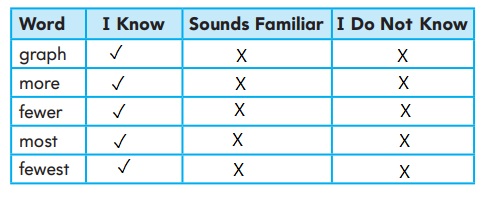
Understand Vocabulary
Use the review words. Label the groups.
Question 1.
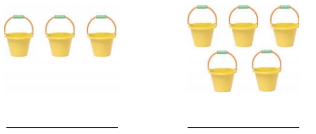
Answer:
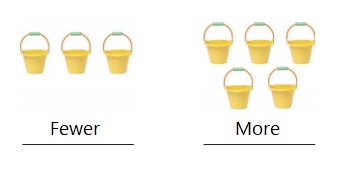
Explanation :
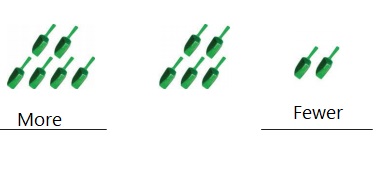
Fewer : a smaller Quantity or amount
More : a greater quantity, number, or amount
Question 2.

Answer:
Explanation :
Fewer : a smaller Quantity or amount
More : a greater quantity, number, or amount
Represent Data Game Graph Game
Materials
![]()
Play with a partner.
- Spin the
 .
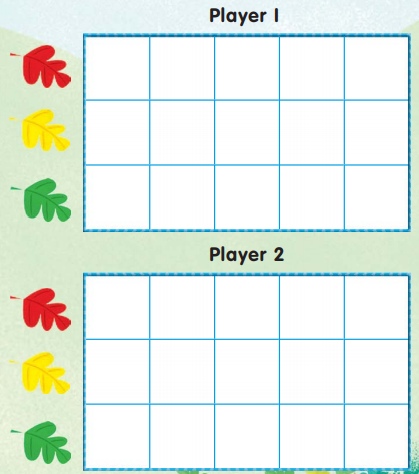
. - Put 1 cube of that color in the correct row of your graph.
- Take turns. Play until each partner has 5 turns.
- The player who went last spins again to get a color.
- The player with more cubes of that color wins. Spin again if you both have the same number of cubes of that color.
Represent Data Vocabulary Game
Picture It
Materials
timer
How to Play
Play with two other players.
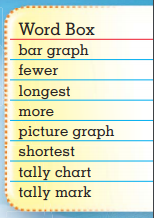
- Choose a secret word from the Word Box. Do not tell the other players.
- Set the timer.
- Draw pictures to show clues for the secret word.
- The first player to guess the word before time runs out gets 1 point.
- Take turns.
- The first player to score 5 points wins.
The Write Way
Reflect
Choose one idea. Draw and write about it.
- Tell the difference between a picture graph and a bar graph.
- Explain how to read a tally chart.

Lesson 10.1 Read Picture Graphs
Essential Question What do the pictures in a picture graph show?
Answer :
A picture graph is a pictorial display of data with symbols, icons, and pictures to represent different quantities. The symbols, icons, and pictures of a picture graph typically represent concepts or ideas, or stand in for a larger quantity of something. … They used pictures known as hieroglyphics to convey a message
Listen and Draw
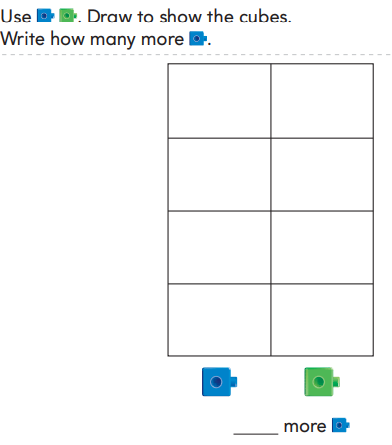
Answer :
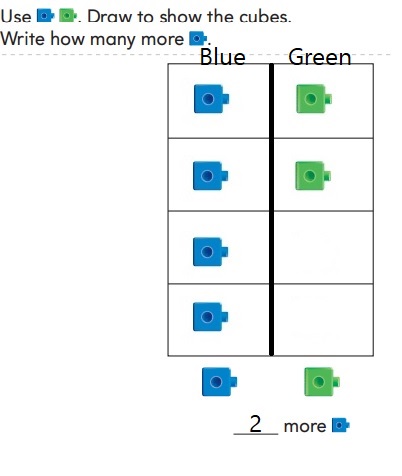
Explanation :
Number of blue cubes = 4
Number of green cubes = 2
Number of blue cubes more than green cubes = 4 – 2 = 2
Therefore, 2 more blue cubes .
MATHEMATICAL PRACTICES
Represent Describe how you can use your picture to compare the cubes.
Answer:
From the above picture we can notice the number of blue and green cubes
Number of blue cubes = 4
Number of green cubes = 2
Number of blue cubes more than green cubes = 4 – 2 = 2
Therefore, 2 more blue cubes .
Model and Draw
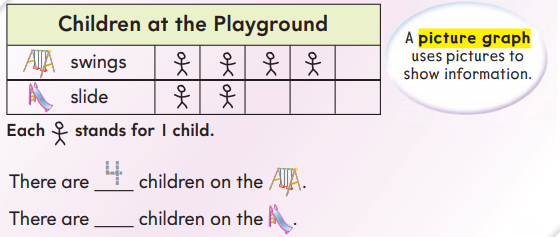
There are more children on the ______
Answer :
There are more children on the Swings.
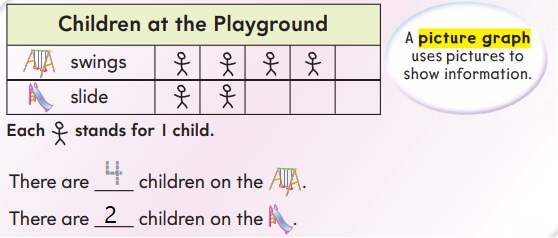
Explanation :
Number of children’s swinging = 4
Number of children’s sliding = 2
There are more children on the swing .
Share and Show

Use the picture graph to answer the question.
Question 1.
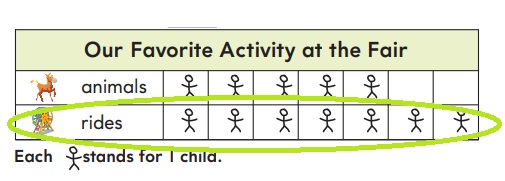
Which activity did more children choose? Circle.
![]()
![]()
Answer:
Explanation :
Number of children’s choose animals = 5
Number of children’s choose rides = 7
So, More children’s choose rides than animals
Question 2.How many children chose ![]() ?
?
______ children
Answer:
Number of children’s choose ![]() = 5
= 5
Question 3.
How many children chose ![]() ?
?
_______ children
Answer:
Number of children’s choose ![]() =7
=7
Question 4.
How many fewer children chose ![]() and
and ![]() ?
?
______ fewer children
Answer:
2 fewer children.
Explanation :
Number of children’s choose ![]() = 5
= 5
Number of children’s choose ![]() =7
=7
Number of fewer children’s choose ![]() and
and ![]() = 7 – 5 = 2
= 7 – 5 = 2
On Your Own
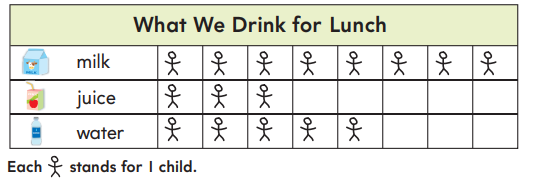
Use the picture graph to answer the question.
Question 5.
How many children drink ![]() ?
?
_______ children
Answer:
Number of children drink ![]() = 8
= 8
Question 6.
How many children in all drink ![]() and
and ![]() ?
?
________ children
Answer:
8 Children .
Explanation :
Number of children drink ![]() = 3
= 3
Number of children drink ![]() =5
=5
Total Number of children drink ![]() and
and ![]() = 3 + 5 = 8
= 3 + 5 = 8
Question 7.
How many fewer children drink ![]() than
than ![]() ?
?
_______ fewer children
Answer:
3 fewer children
Explanation :
Number of children drink ![]() = 8
= 8
Number of children drink ![]() =5
=5
Number of fewer children drink ![]() than
than ![]() = 8 – 5 = 3
= 8 – 5 = 3
Question 8.
How many more children drink ![]() than
than ![]() ?
?
______ more children
Answer:
5 more children
Explanation :
Number of children drink ![]() = 8
= 8
Number of children drink ![]() = 3
= 3
Number of more children drink ![]() than
than ![]() = 8 – 3 = 5
= 8 – 3 = 5
Question 9.
THINK SMARTER
How many children in all drink
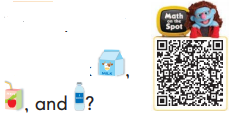
______ children
Answer:
16 children
Explanation :
Number of children drink ![]() = 8
= 8
Number of children drink ![]() = 3
= 3
Number of children drink ![]() =5
=5
Total Number of children drink ![]() ,
, ![]() and
and ![]() = 8 + 3 + 5 = 16 Children’s
= 8 + 3 + 5 = 16 Children’s
Question 10.
GO DEEPER
4 new children join the class. They drink ![]() at lunch. Now, how many more children drink
at lunch. Now, how many more children drink ![]() than
than ![]() ?
?
________ more children
Answer:
0 children .
Explanation :
Number of children drink ![]() = 8
= 8
Number of children drink ![]() = 3
= 3
Number of children drink ![]() =5
=5
after joining 4 children
Number of children drink ![]() = 8
= 8
Number of children drink ![]() = 3 + 4 = 7
= 3 + 4 = 7
Number of children drink ![]() =5
=5
Number of more children drink ![]() than
than ![]() = 0
= 0
Because number of children drink more![]() than
than ![]() so, 0 children .
so, 0 children .
Problem Solving • Applications
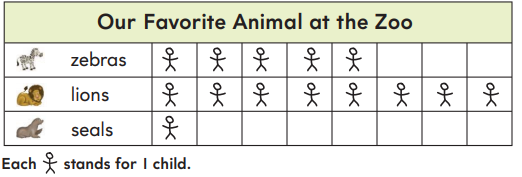
MATHEMATICAL PRACTICE
Write an Equation Write a number sentence to solve the problem.
Question 11.

Answer:

Explanation :
Number of children choose zebras = 5
Number of children choose seals = 1
Total Number of children choose zebras and seals = 5 + 1 = 6
Question 12.

Answer:

Explanation :
Number of children choose lions = 8
Number of children choose seals = 1
Number of more children choose lion than seals = 8 – 1 = 7
Question 13.

Answer:

Explanation :
Number of children choose lions = 8
Number of children choose zebras = 5
Number of children choose seals = 1
Number of more children choose lion than zebras and seals together are = 8 – 5 – 1 = 2
Question 14.
THINK SMARTER
Use the graph at the top. How many children chose

Answer:
Number of children choose lion = 8
TAKE HOME ACTIVITY • Keep track of the weather for one week by drawing a picture each day to show if it is sunny, cloudy, or rainy. At the end of the week, ask your child what the weather was like for most of the week.
Read Picture Graphs Homework & Practice 10.1
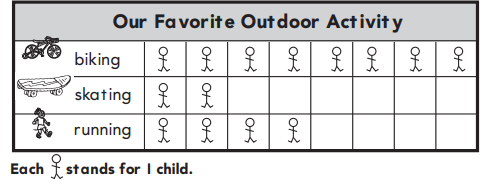
Use the picture graph to answer the question.
Question 1.
How many children chose
![]()
________ children
Answer:
Number of children choose ![]() = 8
= 8
Question 2.
How many children chose ![]() and
and ![]() ?
?
_________ children
Answer:
6 children
Explanation :
Number of children choose ![]() =2
=2
Number of children choose ![]() = 4
= 4
Total Number of children choose ![]() and
and ![]() = 2 + 4 = 6
= 2 + 4 = 6
Problem Solving
Write a number sentence to solve the problem.
Use the picture graph at the top of the page.
Question 3.
How many more children chose ![]() than
than ![]() ?
?
![]()
________ more children
Answer:
4 children
Explanation :
Number of children choose ![]() =8
=8
Number of children choose ![]() = 4
= 4
Number of more children choose ![]() than
than ![]() = 8 – 4 = 4
= 8 – 4 = 4
Question 4.
WRITE
Use numbers and pictures to show why a row with 6 smiley faces has one more than a row with 5 smiley faces.
Answer:
6 rows has one row more than 5 rows because 6 is greater than 5 by 1
Explanation :
As given a row of 6 Smileys…
its pretty obvious why it is 1 more it is shown below
🙂 this is the row of 6 🙂 This is 5
🙂 🙂
🙂 🙂
🙂 🙂
🙂 🙂
🙂 <– This is the the one smiley that shows the answer .
Lesson Check
Use the picture graph to answer the question.
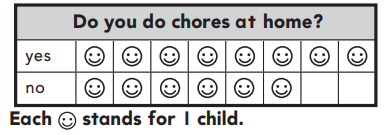
Question 1.
How many children do chores at home?
Write the number.
_______ children
Answer:
Number of children do chores at home = 8
Question 2.
How many more children answered yes than no? Write a number sentence to solve the problem.

________ more children
Answer:
2 more children
Explanation :
Number of children said yes = 8
Number of children said no = 6
Number of more children answered yes than no = 8 – 6 = 2
Spiral Review
Question 3.
What number is ten less than 82? Circle the number. Then write the number sentence.
92 83 81 72
_____ – 10 ____
Answer:

82 – 10 = 72
Explanation:
subtracting 10 from any two digit number means subtracting 1 from tens place of 82 we get 72
Question 4.
Count forward. What number is missing?
Write the number.
110, 111, 112, ___, 114
Answer:
110 , 111 , 112 , 113, 114
Explanation:
Above sequence is in count by one . that means each ones place number is increased by 1 in ones place.
Lesson 10.2 Make Picture Graphs
Essential Question How do you make a picture graph to answer a question?
Listen and Draw
Use ◯ to solve the problem.
Draw to show your work.
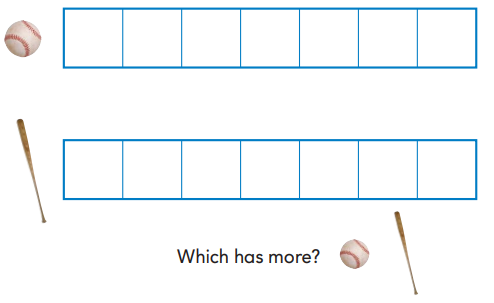
MATHEMATICAL PRACTICES
Compare Describe what the picture graph shows.
Answer:
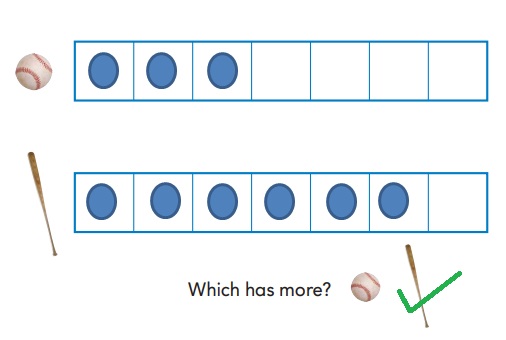
Explanation :
Number of children like bowling = 3
Number of children like batting = 6
Number of more children like batting than bowling = 6 – 3 = 3
Model and Draw
Are there more black or white sheep in the picture? Make a picture graph to find out.
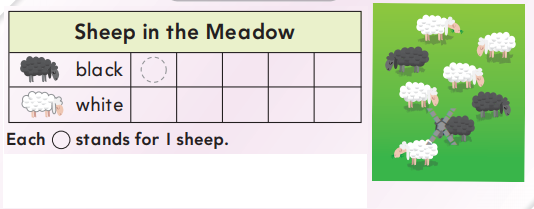
There are more _____ sheep.
Answer:
There are more white sheep .
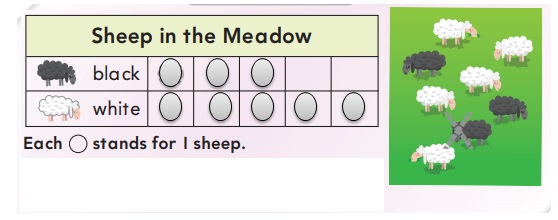
Explanation :
Number of black sheep = 3
Number of white sheep = 5
Share and Show
Do more children like cats or dogs?
Ask 10 friends which pet they like better.
Draw 1 circle for each child’s answer.

Answer :

Use the picture graph to answer each question.
Question 1.
How many children chose ![]() ?
?
_______ children
Answer:
Number of children choose ![]() = 3
= 3
Question 2.
How many children chose ![]() ?
?
______ children
Answer:
Number of children choose ![]() = 7
= 7
Question 3.
Which pet did more children choose? Circle.

Answer:
4 more ![]()

Explanation :
Number of children choose ![]() = 3
= 3
Number of children choose ![]() = 7
= 7
Number of more children choose ![]() than
than ![]() = 7 – 3 = 4
= 7 – 3 = 4
On Your Own
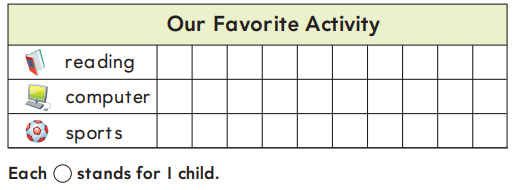
Which activity do the most children like best?
Ask 10 friends. Draw 1 circle for each child’s answer.
Answer :
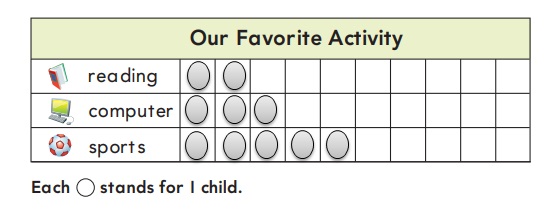
MATHEMATICAL PRACTICE Use Graphs Use the picture graph to answer the question.
Question 4.
How many children chose ![]() ?
?
______ children
Answer:
Number of children choose ![]() = 2
= 2
Question 5.
How many children chose ![]() and
and ![]() ?
?
_______ children
Answer:
8 children
Explanation :
Number of children choose ![]() = 3
= 3
Number of children choose ![]() = 5
= 5
Number of children choose ![]() and
and ![]() = 3 + 5 = 8
= 3 + 5 = 8
Question 6.
Which activity did the most children choose? Circle.

Answer:

Explanation :
Number of children choose ![]() = 2
= 2
Number of children choose ![]() = 3
= 3
Number of children choose ![]() = 5
= 5
The most children choose sports.
Question 7.
Did all your classmates make picture graphs that look the same? Circle yes or no.
Answer:
No, children choices are different .
Question 8.
THINK SMARTER
Write your own question about the graph.

Answer:
How many more children choose ![]() than
than ![]() ?
?
Answer :
2 children
Explanation :
Number of children choose ![]() = 3
= 3
Number of children choose ![]() = 5
= 5
Number of more children choose ![]() than
than ![]() = 5 – 3 = 2
= 5 – 3 = 2
Question 9.
GO DEEPER
Look at the question you wrote. Answer your question.
Answer:
How many more children choose ![]() than
than ![]() ?
?
Answer :
2 children
Explanation :
Number of children choose ![]() = 3
= 3
Number of children choose ![]() = 5
= 5
Number of more children choose ![]() than
than ![]() = 5 – 3 = 2
= 5 – 3 = 2
Problem Solving • Applications
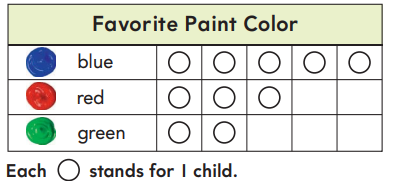
Matt made this picture graph to show the paint colors his friends like best.
Question 10.
How many children chose a paint color?
_______ children
Answer:
Number of children choose a paint color = 10
Explanation :
Number of children choose blue paint = 5
Number of children choose red paint = 3
Number of children choose green paint = 2
Total Number of children choose a paint = 5 + 3 + 2 = 10
Question 11.
How many fewer children chose ![]() ?
?
______ fewer children
Answer:
3 fewer children
Explanation :
Number of children choose blue paint = 5
Number of children choose green paint = 2
Number of fewer children chose ![]() = 5 – 2 = 3 children .
= 5 – 2 = 3 children .
Question 12.
THINK SMARTER+
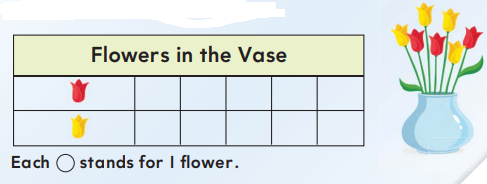
Complete the picture graph to show the number of flowers.
Answer:
Total Number of flowers = 5
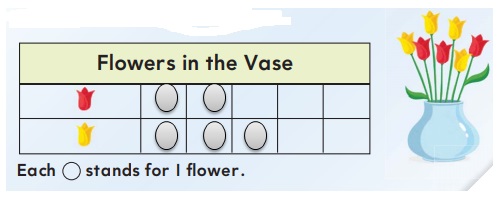
Explanation :
Number of red flowers = 2
Number of yellow flowers = 3
Total Number of flowers = 5
TAKE HOME ACTIVITY • Ask your child to make a picture graph showing how many glasses of water each family member drinks in a day. Discuss how to find who drinks the most water.
Make Picture Graphs Homework & Practice 10.2
Which dinosaur do the most children like best? Ask 10 friends. Draw 1 circle for each child’s answer.

Answer :

Use the picture graph to answer the question.
Question 1.
How many children chose ![]() ?
?
________ children
Answer:
Number of children choose ![]() = 5
= 5
Question 2.
Which dinosaur did the most children choose? Circle.
![]()
Answer:

Explanation :
Number of children choose Tyrannosaurus = 5
Number of children choose Triceratops = 2
Number of children choose Apatosaurus = 3
The most children chosen Tyrannosaurus = 5
Problem Solving
Question 3.
Write your own question about the graph.
___________________
____________________
Answer:
How many more Tyrannosaurus are chosen than Apatosaurus ?
Question 4.
WRITE
Write a question that can be answered by making a picture graph.
Answer:
How many more Tyrannosaurus are chosen than Apatosaurus ?
Explanation :
Number of children choose Tyrannosaurus = 5
Number of children choose Apatosaurus = 3
Number of more Tyrannosaurus are chosen than Apatosaurus = 5 – 3 = 2
Lesson Check
Use the picture graph to answer the question.

Question 1.
How many children use their right hand? Write the answer.
_______ children
Answer:
Number of children use their right hand = 8
Question 2.
How many more children use their right hand than their left? Write a number sentence to solve the problem.
![]()
______ more children
Answer:
5 children
Explanation :
Number of children use their left hand = 3
Number of children use their right hand = 8
Number of more children use their right hand than their left = 8 – 3 = 5
Spiral Review
Question 3.
Write is the sum.
6 + 3 = _____
Answer:
6 + 3 = 9
Question 4.
Write the difference. Write how many tens.
60 – 20 = _____
_____ tens
Answer:
60 – 20 = 40
4 tens .
Lesson 10.3 Read Bar Graphs
Essential Question How can you read a bar graph to find the number that a bar shows?
Listen
Write a question about the graph.
Use ◯ to help solve the problem.
Answer :
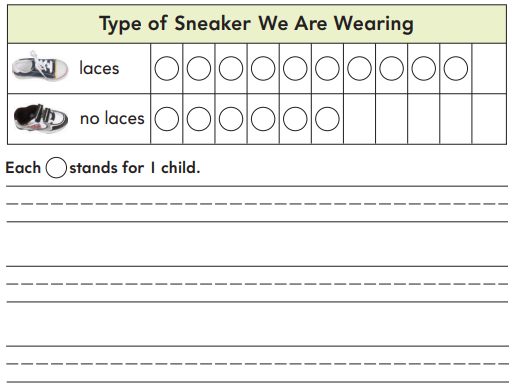
How many more children are with laces than no laces .
Answer : 5 more children .
Explanation :
Number of children with laces = 10
Number of children with no laces = 5
Number of more children with laces than no laces = 10 – 5 = 5
MATHEMATICAL PRACTICES
Apply Describe how the class made this picture graph.
Answer:
The class made the picture graph of Type of sneaker we are wearing with laces and no laces.
Each circle represents one child.
Number of children with laces = 10
Number of children with no laces = 5
Share and Show
Use the bar graph to answer the question.
Question 1.
How many children chose ![]() ?
?
______ children
Answer:
Number of children choose ![]() = 6
= 6
Question 2.
How many children chose ![]() ?
?
_______ children
Answer:
Number of children choose ![]() =2
=2
Question 3.
How many more children chose ![]() than
than ![]() ?
?
_______ more children
Answer:
4 more children
Explanation :
Number of children choose ![]() = 6
= 6
Number of children choose ![]() =2
=2
Number of more children chose ![]() than
than ![]() = 6 – 2 = 4
= 6 – 2 = 4
Question 4.
Which art tool did the fewest children choose? Circle.
![]()
Answer:

Explanation :
Number of children choose ![]() = 6
= 6
Number of children choose ![]() =2
=2
Number of children choose marker = 5
fewer than all is crayon ![]()
Question 5.
Which art tool did the most children choose? Circle.
![]()
Answer:

On Your Own
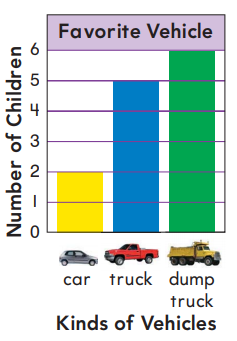
MATHEMATICAL PRACTICE Use Graphs Use the bar graph to answer the question.
Question 6.
How many children chose ![]() ?
?
_______ children
Answer:
Number of children chose ![]() = 2
= 2
Question 7.
How many children chose ![]() ?
?
______ children
Answer:
Number of children choose ![]() = 6
= 6
Question 8.
How many children in all chose ![]() and
and ![]() ?
?
_______ children
Answer:
8 children
Explanation :
Number of children chose ![]() = 2
= 2
Number of children choose ![]() = 6
= 6
Total number of children in all chose ![]() and
and ![]() = 2 + 6 = 8
= 2 + 6 = 8
Question 9.
How many more children chose ![]() and
and ![]() ?
?
_______ more children
Answer:
3 more children
Explanation :
Number of children chose ![]() = 2
= 2
Number of children chose ![]() = 5
= 5
Number of more children chose ![]() and
and ![]() = 5 – 2 = 3
= 5 – 2 = 3
Question 10.
Which vehicle did the most children choose? Circle.

Answer:
The most children choose![]()

Question 11.
THINK SMARTER
Order the vehicles from least to most votes. Write 1 for the least votes and 3 for the most votes.

Answer:

Problem Solving • Applications
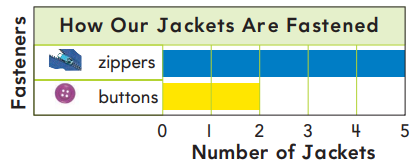
Use the bar graph to answer the question.
Question 12.
Kim puts on a jacket with ![]() .
.
Add her jacket to the graph.
Now how many jackets have ![]() ?
?
_______ jackets
Answer:
3 jackets
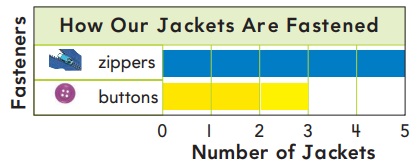
Explanation :
Number of zippers = 5
Number of buttons = 2
After Kim puts on a jacket with ![]() .
.
After adding kim jacket to the graph
Number of zippers = 5
Number of buttons = 3
Question 13.
GO DEEPER
Ed adds a row to the graph to show jackets with snaps. 2 fewer jackets have snaps than have zippers. How many jackets have snaps?
______ jackets
Answer:
3 Jackets
Explanation :
Number of zippers = 5
Number of snaps = ?
2 fewer jackets have snaps than have zippers
Number of snaps = 5 – 2 = 3 snaps .
Question 14.
THINK SMARTER
How many more jackets have ![]() than
than ![]() ? Circle the number in the box.
? Circle the number in the box.

Answer:
3 more jackets have ![]() than
than ![]()

Explanation :
Number of zippers = 5
Number of buttons = 2
Number of more jackets have ![]() than
than ![]() = 5 – 2 = 3
= 5 – 2 = 3
TAKE HOME ACTIVITY • Have your child look through newspapers and magazines for examples of bar graphs. Talk about what information is shown in each graph you find.
Read Bar Graphs Homework & Practice 10.3
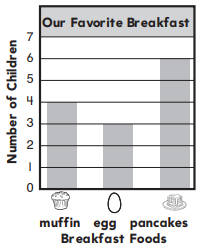
Use the bar graph to answer the question.
Question 1.
How many children chose ![]() ?
?
______ children
Answer:
Number of children chose ![]() = 3
= 3
Question 2.
How many more children chose ![]() than
than ![]() ?
?
______ more children
Answer:
1 more children
Explanation :
Number of children chose ![]() = 3
= 3
Number of children chose ![]() = 4
= 4
Number of more children chose ![]() than
than ![]() = 4 – 3 = 1
= 4 – 3 = 1
Problem Solving
Use the bar graph to answer the question.
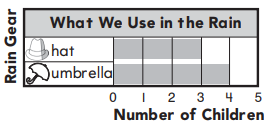
Question 3.
Claudette uses an ![]() . Add her to the graph. Now how many more children use an
. Add her to the graph. Now how many more children use an ![]() than a
than a ![]() ?
?
______ more children
Answer:
3 more children
Explanation :
Number of children use ![]() = 3
= 3
Number of children use ![]() = 5
= 5
Claudette uses an ![]() after adding this to the graph we get ,
after adding this to the graph we get ,
Number of children use ![]() = 3
= 3
Number of children use ![]() = 6
= 6
Number of more children use an ![]() than a
than a ![]() = 6 – 3 = 3
= 6 – 3 = 3
Question 4.
WRITE
Use numbers and pictures to compare two items in a bar graph.
Answer:
Lesson Check
Use the bar graph to answer the question.
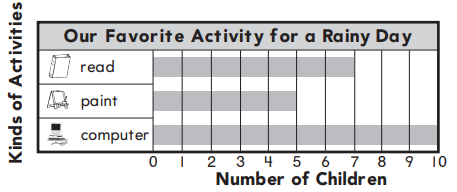
Question 1.
How many more children chose  ?
?
_______ more children
Answer:
5 more children
Explanation :
Number of children choose Computer = 10
Number of children choose paint = 5
Number of more children chose  = 10 – 5 = 5
Spiral Review
Question 2.
Write a subtraction sentence you can solve by using 9 + 7 = 16.
___ – ____ = ____
Answer:
9 + 7 = 16
16 – 7 = 9
16 – 9 = 7
Question 3.
How many fewer ![]() are there ?
are there ?
Subtract to compare.
7 – 5 = ____
____ fewer

Answer:
2 fewer balls
Explanation :
Number of hands = 7
Number of balls = 5
Number of fewer ![]() are there = 7 – 5 = 2
are there = 7 – 5 = 2
2 fewer balls
Lesson 10.4 Make Bar Graphs
Essential Question How does a bar graph help you compare information?
Answer :
Bar graphs are used to compare things between different groups or to track changes over time. However, when trying to measure change over time, bar graphs are best when the changes are larger.
Listen and Draw
Use ![]() to model the problem.
to model the problem.
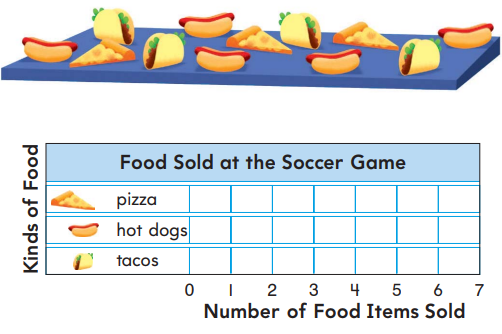
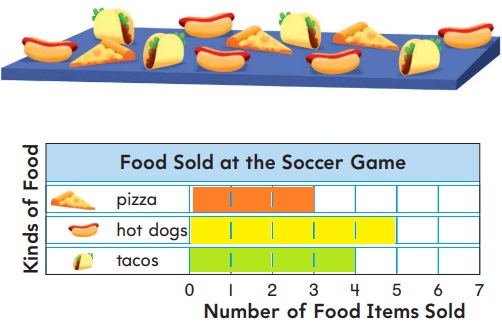
Color 1 box for each food item to complete the graph.
Answer :
MATHEMATICAL PRACTICES
Model How do you know that you counted each food in the picture?
Answer:
From the given figure we know the
Number of pizzas = 3
Number of hot dogs = 5
Number of tacos = 4
The same counted food is represented the bar graph by marking the graph up to the quantity number .
Model and Draw
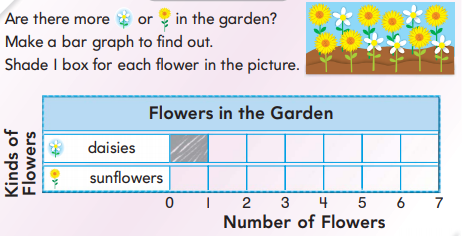
There are more ______ in the garden.
Answer:
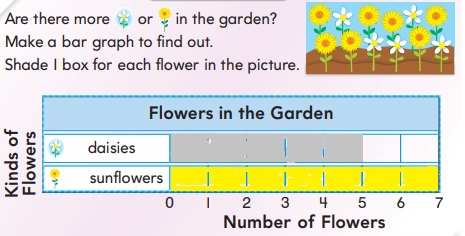
Number of daisies = 5
Number of sunflowers = 7
There are more sunflowers in the garden .
Share and Show
Do more children write with their left hand or right hand? Ask 10 friends which hand they use. Make a bar graph.

Question 1.
Which hand do more children use to write? _______
Answer:
Number of children use right hand = 8
Number of children use left hand = 2
More children use to write with right hand.
On Your Own
MATHEMATICAL PRACTICE Draw Conclusions Do children like ![]() , or best? Ask 10 friends which toy they like best.
, or best? Ask 10 friends which toy they like best.
Question 2.
Make a bar graph. Write a title and labels for your graph.
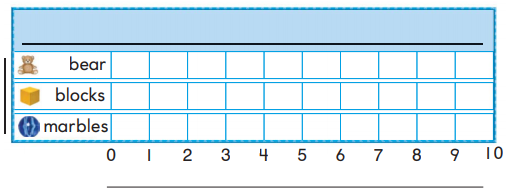
Answer:
Question 3.
Which toy did the most children choose? Circle.

Answer:
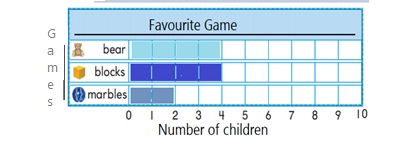
Both bear and marbles are liked most of the children’s

Number of children like bear = 4
Number of children like blocks = 4
Question 4.
How many children chose ![]() ?
?
______ children
Answer:
Number of children choose blocks = 4
Question 5.
THINK SMARTER
How are picture graphs and bar graphs alike?
Answer:
Picture graph vs bar graph
In 3rd grade they create and read scaled versions of these types of graph where quantities are represented using a different scale. For bar graphs this means the intervals are greater than one and, for picture graphs, the symbol or picture also represents more than one (usually 2, 5, 10, or other appropriate scale).
TAKE HOME ACTIVITY • Your child has learned how to make picture graphs and bar graphs. Ask your child to explain how bar graphs are different from picture graphs.
Make Bar Graphs Homework & Practice 10.4
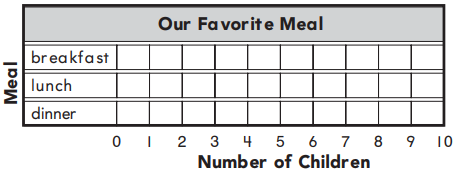
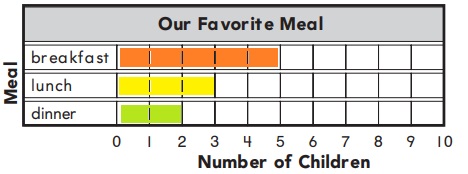
Which is your favorite meal?
Question 1.
Ask 10 friends which meal they like best. Make a bar graph.
Answer:
Question 2.
How many children chose breakfast?
_____ children
Answer:
Number of children choose breakfast = 5
Question 3.
Which meal was chosen by the most children?
__________
Answer:
The breakfast meal was chosen by the most children
Problem Solving
Question 4.
What if 10 children chose breakfast? How many children could choose lunch or dinner?
_______ children
Answer:
Total number of students = 10
Number of children chosen breakfast = 10
Remaining number of children = 10 – 10 = 0
So, No children left to choose lunch and dinner .
Question 5.
WRITE
Use words and pictures to show how to make a bar graph about favorite storybooks.
Answer:
Lesson Check
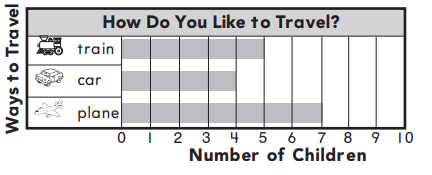
Use the bar graph to answer the question.
Question 1.
How many more children chose ![]() ?
?
_____ more children
Answer:
2 more children
Explanation :
Number of children choose plane = 7
Number of children choose train = 5
Number of more children chose ![]() = 7 – 5 = 2
= 7 – 5 = 2
Spiral Review
Question 2.
Write the number sentence that completes the related facts.
7 + 8 = 15
8 + 7 = 15
15 – 8 = 7
![]()
Answer:
15 – 7 = 8
Question 3.
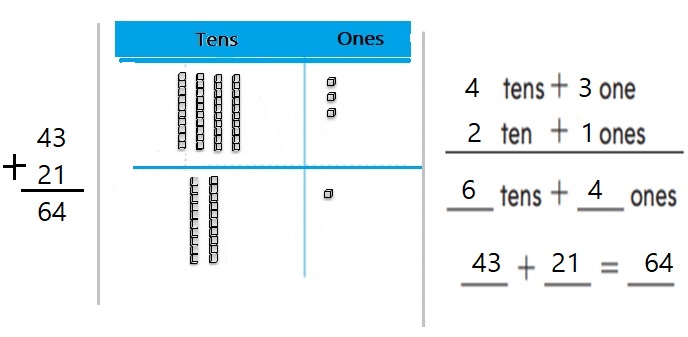
What is the sum? Use tens and ones to add.

Answer:
Represent Data Mid-Chapter Checkpoint
Concepts and Skills
Use the picture graph to answer the questions.

Question 1.
How many children do not wear glasses? ________
Answer:
Number of children do not wear glasses = 8
Question 2.
How many children wear glasses? ______
Answer:
Number of children wear glasses = 2
THINK SMARTER
Use the bar graph to answer the questions.
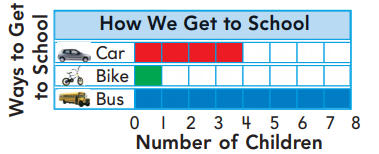
Question 3.
How many children take the bus to school? ______
Answer:
Number of children take the bus to school = 8
Question 4.
THINK SMARTER
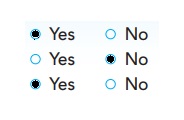
Is the sentence true? Choose Yes or No.
5 children ride in a car or ride a bike.
More children go by car than by bus.
Fewer children go by bike than by car.

Answer:
Explanation :
Number of children choose car = 4
Number of children choose bike = 1
Total Number of children choose bike or ride = 4 + 1 = 5
Number of children choose car =4
Number of children choose bus = 8
More children choose bus not car .
Number of children choose car = 4
Number of children choose bike = 1
Fewer children go by bike than by car. is true
Lesson 10.5 Read Tally Charts
Essential Question How do you count the tallies on a tally chart?
Answer :
Tally marks are a quick way of keeping track of numbers in groups of five. One vertical line is made for each of the first four numbers; the fifth number is represented by a diagonal line across the previous four
Listen and Draw
Use ◯ to solve the problem. Draw to show your work. Write how many.
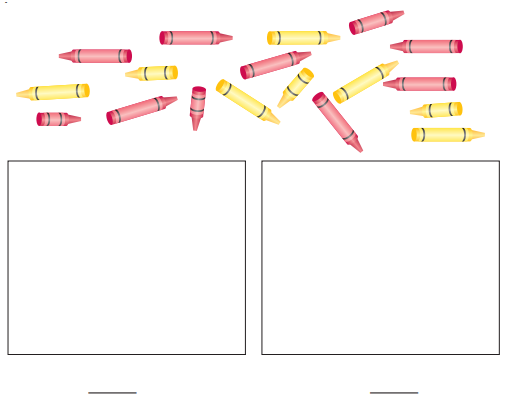
Answer :
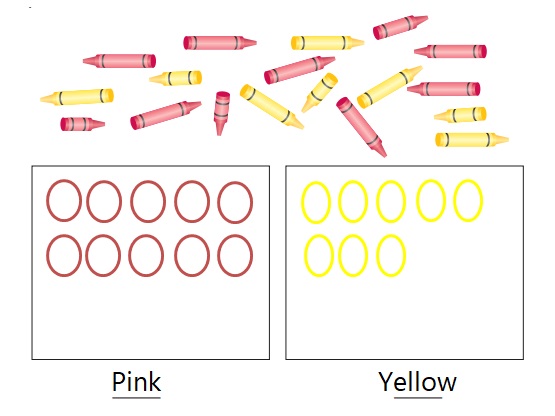
MATHEMATICAL PRACTICES
Reasoning How did you sort the counters?
Answer:
Number of pink crayons = 10
Number of yellow crayons = 8
as in above figure ,
10 circles are represented in first column of pink as we have 10 pink crayons
8 circles are represented in second column of yellow as we have 8 Yellow crayons
Share and Show
Complete the tally chart.
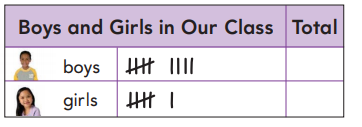
Use the tally chart to answer each question.
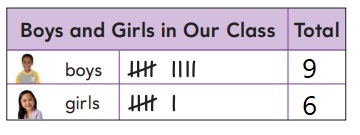
Question 1.
How many girls are in the class?
______ girls
Answer:
Number of girls in a class = 6
Question 2.
How many boys are in the class?
_____ boys
Answer:
Number of boys in a class = 9
Question 3.
How many children are in the class in all?
______ children
Answer:
15 children
Explanation :
Number of boys in a class = 9
Number of girls in a class = 6
Total Number of children are in the class in all = 9 + 6 = 15
Question 4.
Are there more boys or girls in the class?
__________
Answer:
More boys in a class
Explanation :
Number of boys in a class = 9
Number of girls in a class = 6
we have more number of boys
On Your Own
Complete the tally chart.
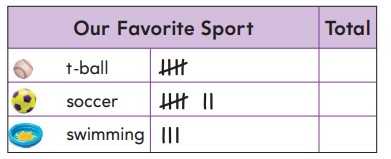
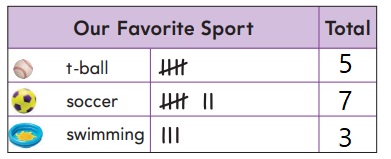
Use the tally chart to answer the question.
Question 5.
How many children chose ![]() ?
?
______ children
Answer:
Number of children chose ![]() = 7
= 7
Question 6.
How many more children chose ![]() ?
?
_______ more children
Answer:
2 more children
Explanation :
Number of children choose t-ball = 5
Number of children choose swimming = 3
Number of more children chose ![]() = 5 – 3 = 2
= 5 – 3 = 2
Question 7.
Which sport did the most children choose? Circle.

Answer:
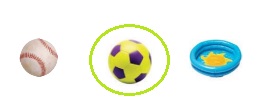
The most children choose Soccer
Question 8.
THINK SMARTER
Write your own question about the tally chart.

Answer:
How many fewer children chose swimming than t-ball?
_______ fewer children
Answer :
2 fewer children
Explanation :
Number of children choose t-ball = 5
Number of children choose swimming = 3
Number of more children chose swimming than t-ball = 5 – 3 = 2
Question 9.
GO DEEPER
Sam asked some other children which sport they like. They all chose ![]() 8. Now the most children chose
8. Now the most children chose ![]() . How many children did Sam ask?
. How many children did Sam ask?
_______ children
Answer:
Number of Children sam asked = 8 as 8 children choose swimming .
Problem Solving • Applications

Answer :

MATHEMATICAL PRACTICE Connect Symbols and Words Complete each sentence about the tally chart. Write greater than, less than, or equal to.
Question 10.
The number of tallies for ![]() is ________
is ________
the number of tallies for ![]() .
.
Answer:
The number of tallies for ![]() is 10
is 10
the number of tallies for ![]() is 4
is 4
Question 11.
The number of tallies for ![]() is _______
is _______
the number of tallies for ![]() .
.
Answer:
The number of tallies for ![]() is 4
is 4
the number of tallies for ![]() is 4
is 4
Question 12.
The number of tallies for ![]() is _______
is _______
the number of tallies for ![]() .
.
Answer:
The number of tallies for ![]() is 4
is 4
the number of tallies for ![]() is 10
is 10
Question 13.
GO DEEPER
The number of tallies for ![]() is _______
is _______
the number of tallies for both ![]() and
and ![]() .
.
Answer:
The number of tallies for ![]() is 10
is 10
the number of tallies for both ![]() and
and ![]() = 4 + 4 = 8
= 4 + 4 = 8
Question 14.
THINK SMARTER
How many tallies are there in all?

Answer:
The number of tallies for ![]() is 10
is 10
the number of tallies for ![]() is 4
is 4
The number of tallies for ![]() is 4
is 4
Total Number of tallies = 10 + 4 + 4 = 18

TAKE HOME ACTIVITY • Together with your child, make a tally chart showing how many times you all say the word “eat” during a meal. Then have your child write the number.
Read Tally Charts Homework & Practice 10.5
Complete the tally chart.
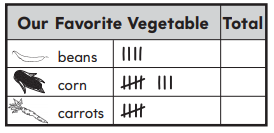
Answer :
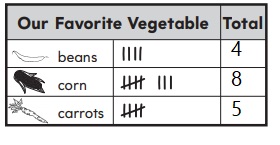
Use the tally chart to answer each question.
Question 1.
How many children chose ![]() ?
?
______ children
Answer:
Number of children choose ![]() = 5
= 5
Question 2.
How many more children chose ![]() and
and ![]() ?
?
______ more children
Answer:
3 more children
Explanation :
Number of children choose ![]() = 5
= 5
Number of children choose ![]() = 8
= 8
Number of more children chose ![]() and
and ![]() = 8 – 5 = 3
= 8 – 5 = 3
Problem Solving
Complete each sentence about the tally chart. Write greater than, less than, or equal to.
Question 3.
The number of children who chose ![]() is __________ the number who chose
is __________ the number who chose ![]() .
.
Answer:
The number of children who chose ![]() is less than the number who chose
is less than the number who chose ![]() .
.
Question 4.
The number of children who chose ![]() is __________ the number who chose
is __________ the number who chose ![]() .
.
Answer:
The number of children who chose ![]() is more than the number who chose
is more than the number who chose ![]() .
.
Question 5.
WRITE
Use words, numbers, or pictures to show how to group and count tally marks for the number 8.
Answer:

one set of 5 tally and 3 vertical lines.
Lesson Check
Use the tally chart to answer each question.
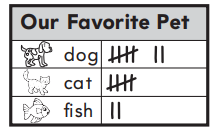
Question 1.
How many children chose ![]() ?
?
_______ children
Answer:
Number of children choose ![]() = 5
= 5
Question 2.
How many more children chose ![]() ?
?
______ more children
Answer:
5 more children
Explanation :
Number of children choose dog = 7
Number of children choose fish = 2
Number of more children chose ![]() = 7 – 2 = 5
= 7 – 2 = 5
Spiral Review
Question 3.
Complete the number sentence.
There are 8 apples. 6 apples are red. The rest are green. How many apples are green?

Answer:
8 – 6 = 2
number of green apples = 2
Question 4.
Write the sum.
34 + 40 = ______
Answer:
34 + 40 = 74
Lesson 10.6 Make Tally Charts
Essential Question Why is a tally chart a good way to show information that you have collected?
Listen
Complete the tally chart.
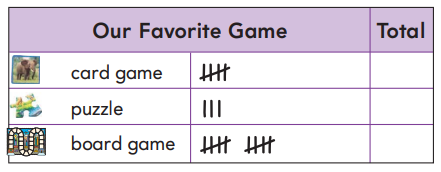
Answer :
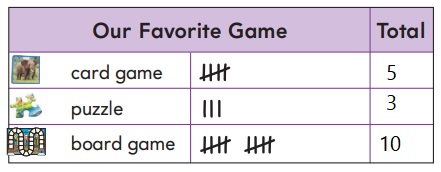
Use the tally chart to answer the question.
Question 1 :
Which game did the most children choose? Circle.

Answer :

Explanation :
Number of children choose card game = 5
Number of children choose puzzle game = 3
Number of children choose board game = 10
The most children like board game
Question 2:
Which game did the fewest children choose? Circle.

Answer:

Explanation :
Number of children choose card game = 5
Number of children choose puzzle game = 3
Number of children choose board game = 10
The fewer children like card game
MATHEMATICAL PRACTICES
Analyze How do you know which game is the favorite?
Answer:
Board game
Explanation :
Number of children choose card game = 5
Number of children choose puzzle game = 3
Number of children choose board game = 10
The most children like board game
How can you make a tally chart to show the boats at the lake?
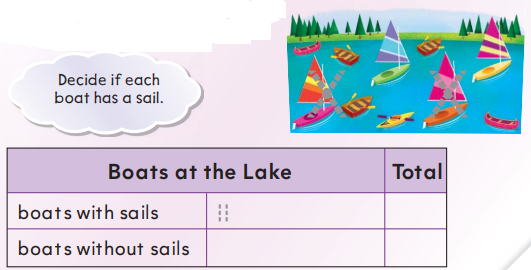
Answer:
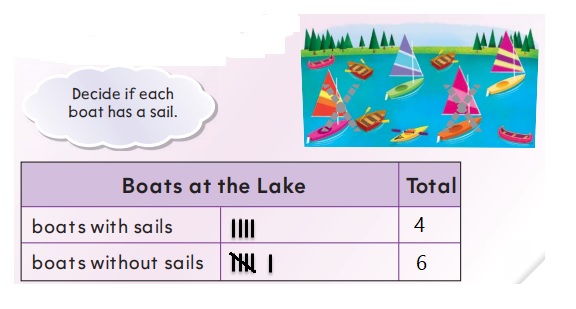
Explanation :
From the above figure we notice
Number of boats with sail = 4
Number of boats without sails = 6
Share and Show
Use the picture to complete the tally chart. Then answer each question.

Answer :
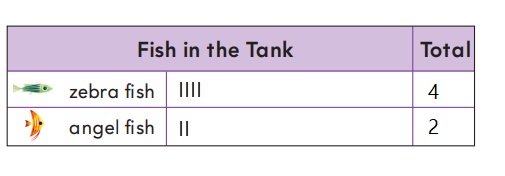
Question 1.
How many ![]() are in the tank?
are in the tank?
______ ![]()
Answer:
Number of ![]() are in the tank = 4
are in the tank = 4
Question 2.
How many more ![]() than
than ![]() are there?
are there?
______ more ![]()
Answer:
2 more ![]()
Explanation :
Number of ![]() are in the tank = 4
are in the tank = 4
Number of ![]() in the tank = 2
in the tank = 2
Number of more ![]() than
than ![]() = 4 – 2 = 2
= 4 – 2 = 2
Question 3.
How many ![]() and
and ![]() are in the tank?
are in the tank?
______ fish
Answer:
6 fishes
Explanation :
Number of ![]() are in the tank = 4
are in the tank = 4
Number of ![]() in the tank = 2
in the tank = 2
Number of ![]() and
and ![]() = 4 + 2 = 6
= 4 + 2 = 6
On Your Own
Which of these snacks do most children like the best?
Ask 10 friends. Make 1 tally mark for each child’s answer.
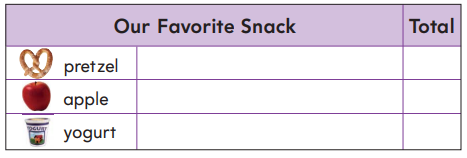
Answer :
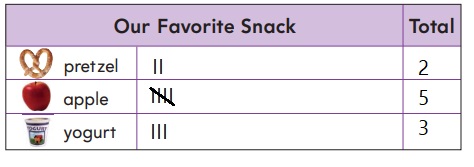
Use the tally chart to answer each question.
Question 4.
How many children chose ![]() ?
?
_______ children
Answer:
Number of children chose ![]() = 2
= 2
Question 5.
How many children chose ![]() ?
?
______ children
Answer:
Number of children choose ![]() = 3
= 3
Question 6.
Which snack do most children like best? Circle.

Answer:
Apple

Explanation :
Number of children chose ![]() = 2
= 2
Number of children choose apple = 5
Number of children choose ![]() = 3
= 3
Apple is chosen by more number of children
Question 7.
THINK SMARTER
What if
6 children out of the 10 chose ![]() ? Which snack would be the favorite? Circle it.
? Which snack would be the favorite? Circle it.
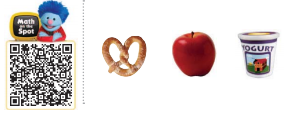
Answer:
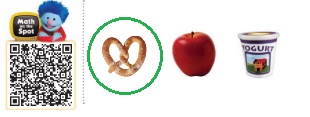
Explanation :
6 children out of the 10 chose ![]()
Remaining number of children = 10 – 6 = 4
So, 6 > 4
Question 8.
Explain Write your own question about the tally chart.
Answer:
Which snack do fewer children like?
Answer :
Pretzel
Explanation :
Number of children chose ![]() = 2
= 2
Number of children choose apple = 5
Number of children choose ![]() = 3
= 3
Problem Solving • Applications
MATHEMATICAL PRACTICE Analyze Relationships Jenna asked 10 friends to choose their favorite subject. She will ask 10 more children.
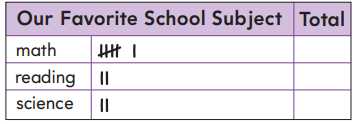
Answer :
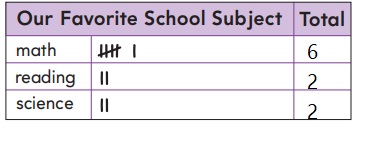
Question 9.
Predict. Which subject will children most likely choose?
Answer:
Math
Explanation :
Number of children like math = 6
Number of children like reading = 2
Number of children like science = 2
Number of children most likely choose is math
Question 10.
Predict. Which subject will children least likely choose?
Answer:
Both Reading and science
Explanation :
Number of children like math = 6
Number of children like reading = 2
Number of children like science = 2
Both science and reading is chosen by same number of children .
Question 11.
THINK SMARTER
How can you prove if your prediction is good? Try it.
Answer:
Prediction will be good only if the children gives the same response as the prediction done in the tally results .
Question 12.
THINK SMARTER
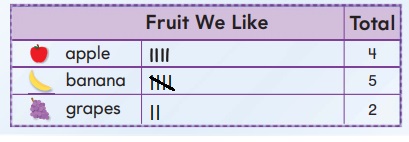
Complete the tally chart to show the number of votes.

Answer:
TAKE HOME ACTIVITY • With your child, survey friends and family to find out their favorite food. Draw tally marks to record the results and then prepare the food.
Make Tally Charts Homework & Practice 10.6
Which color do most children like best? Ask 10 friends. Make 1 tally mark for each child’s answer.
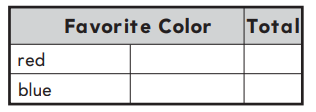
Answer :
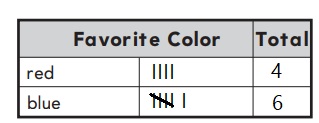
Question 1.
How many children chose red?
______ children
Answer:
Number of children choose red = 4
Question 2.
How many children chose blue?
______ children
Answer:
Number of children choose blue = 6
Problem Solving
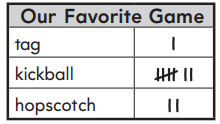
Jason asked 10 friends to choose their favorite game. He will ask 10 more children.
Question 3.
Predict. Which game will children most likely choose?
___________
Answer:
kick ball
Explanation :
Number of children like tag = 1
Number of children like kickball = 7
Number of children like hopscotch = 2
Therefore, most of the children likely choose kick ball
Question 4.
Predict. Which game will children least likely choose?
____________
Answer:
tag
Explanation :
Number of children like tag = 1
Number of children like kickball = 7
Number of children like hopscotch = 2
Therefore, number of children least likely choose tag .
Question 5.
WRITE
Write a question that can be answered by making a tally chart.
Answer:
How many more children like kickball than tag .
Answer :
6 more children
Explanation :
Number of children like tag = 1
Number of children like kickball = 7
Number of more children like kickball than tag = 7 – 1 = 6
Lesson Check
Question 1.
Which insect did the most children choose? Circle the answer.
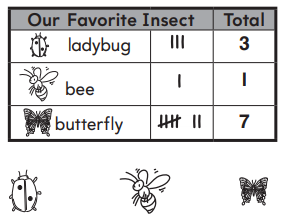
Answer:
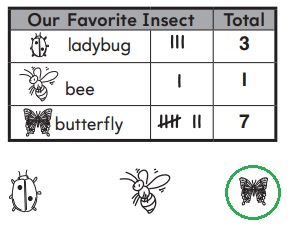
Spiral Review
Question 2.
Circle the number that is greater than 54. Write the numbers.
45
50
54
57
_____ is greater than 54.
____ > 54
Answer:
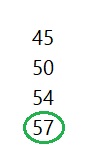
Explanation :
57 is greater than 54.
57 > 54
Question 3.
Use the model. Write the number three different ways.
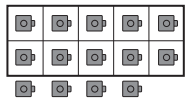
____ tens ____ ones
____ + _____
_____
Answer:
1 tens 3 ones
10 + 3
13
Lesson 10.7 Problem Solving • Represent Data
Essential Question How can showing information in a graph help you solve problems?
Brad sees many animals at the park. How can you find how many animals Brad sees?
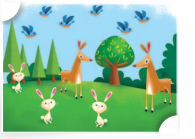
Show how to solve the problem.
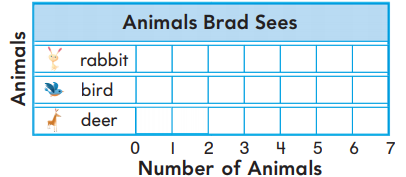
____ + ____ + ____ = ____ animals
Answer:
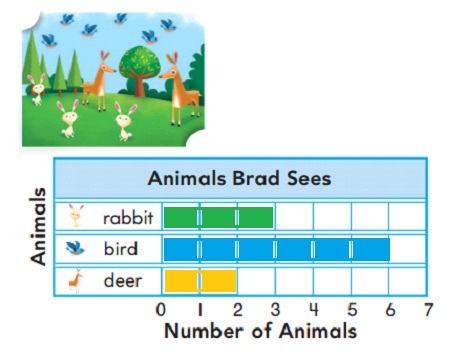
Number of rabbits = 3
Number of Birds = 6
Number of deer = 2
Total Number of animals seen by brad = 3 + 6 + 2 = 11 Animals
HOME CONNECTION • Your child learned how to represent data from a picture in a bar graph. Have your child explain why it is easier to use data in a bar graph than in a picture.
Try Another Problem

Make a graph to solve.
Question 1.
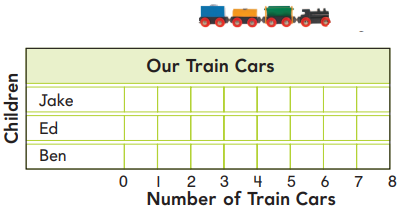
Jake has 4 more train cars than Ed. Ed has 3 train cars. Ben has 2 fewer train cars than Ed. How many train cars does Jake have?
_______ train cars
Answer:
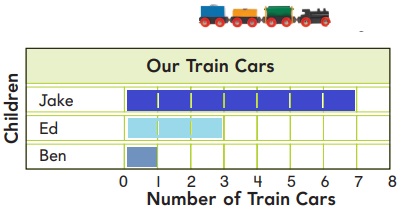
Explanation :
Number of train cars ed have = 3
Number of train cars jake have = 4 more train cars than Ed = 4 + 3 = 7
Number of trains ben have = 2 fewer train cars than Ed = 3 – 2 = 1
Question 2.
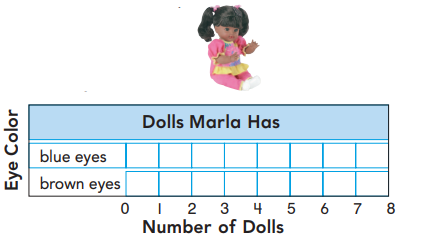
Marla has 8 dolls. Three dolls have blue eyes. The rest have brown. How many dolls have brown eyes?
_____ dolls
Answer:
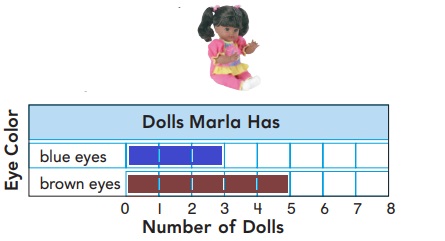
Explanation :
Number of dolls Marla have = 8
Number of dolls with blue eyes = 3
Number of dolls with brown eyes = 8 – 3 = 5
Share and Show
MATHEMATICAL PRACTICE Make Connections Find out about the eye color of your classmates.
Question 3.
Write a question you can ask your friends.
Answer:
The eye color of your 5 classmates are been asked. 3 classmates have eye color black and Remaining classmates have brown color. find how many classmates have brown color.
Explanation :
Number of classmates = 5
Number of classmates with black eye color =3
Number of classmates with brown color eye = 5 – 3 = 2
Question 4.
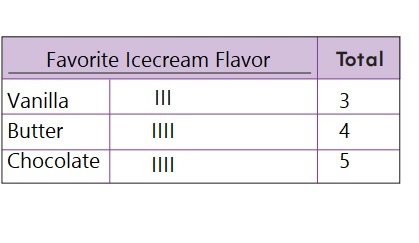
Ask 10 friends your question. Make a tally chart.
Answer:
Question 5.
THINK SMARTER
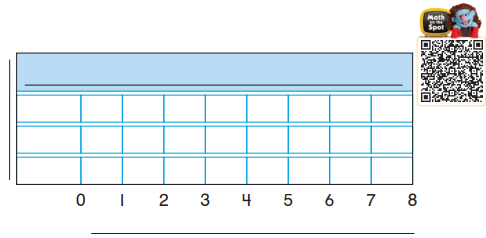
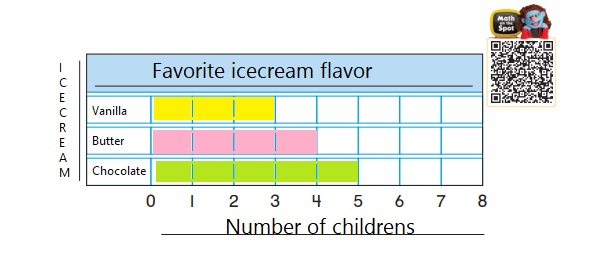
Use the tally chart to make a bar graph.
Answer:
Question 6.
Explain What did you learn from the graph?
Answer:
The graph explain about the favorite ice cream flavor
Number of children like Vanilla = 3
Number of children like Butter scotch = 4
Number of children like Chocolate = 5
On Your Own
WRITE
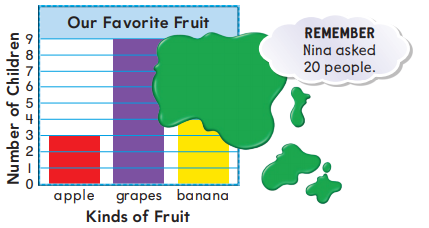
What is your favorite fruit? Nina asked 20 children this question. Then she made a bar graph. But Nina spilled paint on the graph.
Question 7.
How many children chose grapes?
_______ children
Answer:
Number of children choose grapes = 9
Question 8.
GO DEEPER
How many children chose bananas?
_____ children
Answer:
12 children
Explanation :
Total number children were asked = 20
Number of children choose apple = 3
Number of children choose grapes = 9
Number of children choose banana = 20 – 3 – 9 = 12
Question 9.
THINK SMARTER+
Write another question that can be answered by using the graph.
Answer:
How many more number of children chosen grapes than apple ?
Answer :
6 more children
Explanation :
Number of children choose apple = 3
Number of children choose grapes = 9
Number of more children chosen grapes than apple = 9 – 3 = 6
TAKE Home Activity • Work with your child to make a tally chart and a bar graph showing the favorite color of 10 family members or friends. Talk about the results.
Problem Solving • Represent Data Homework & Practice 10.7
Bella made a tally chart to show the favorite sport of 10 friends.
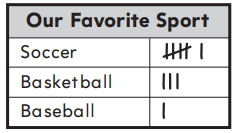
Use the tally chart to make a bar graph.
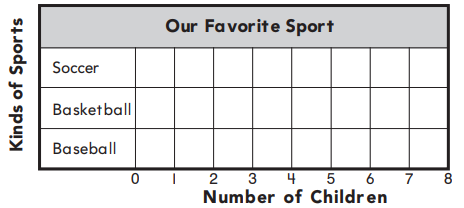
Answer :
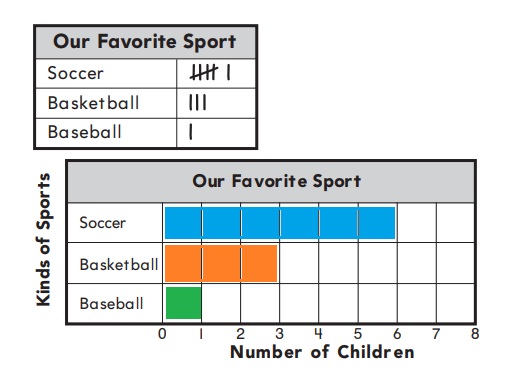
Use the graph to solve.
Question 1.
How many friends chose soccer?
_______ friends
Answer:
Number of friends choose soccer = 6
Question 2.
How many friends chose soccer or basketball?
______ friends
Answer:
3 friends
Explanation :
Number of friends choose soccer = 6
Number of friends choose basket ball = 3
Question 3.
WRITE
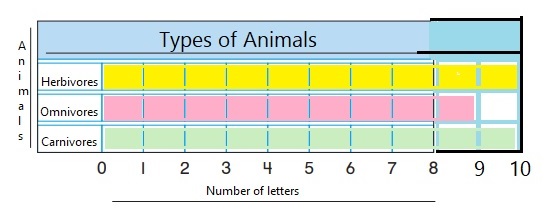
Write the names of 3 types of animals. Count the letters in each name. Make a bar graph showing the letter for each animal.
Answer:
Three types of animals = herbivores, omnivores, and carnivores.
Number of letters in herbivores = 10
Number of letters in omnivores = 9
Number of letters in carnivores = 10
Lesson Check
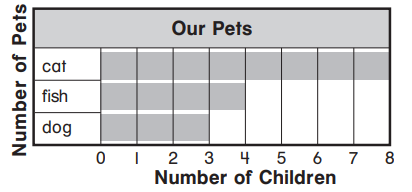
Question 1.
Use the graph. How many more children have fish than a dog?
______ more
Answer:
1 more fish
Explanation :
Number of children have fish = 4
Number of children have dog = 3
Number of more children have fish than a dog = 4 – 3 = 1
Spiral Review
Question 2.
Which ribbon is the shortest? Color the shortest ribbon.

Answer:
Third ribbon

Question 3.
Look at the hour hand. Write the time.
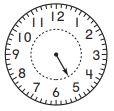
______
Answer:
5 o’ clock
Explanation :
The Short hand or the hour hand points at 5 so, the time is 5 o’ clock .
Represent Data Review/Test
Use the picture graph to answer the questions.
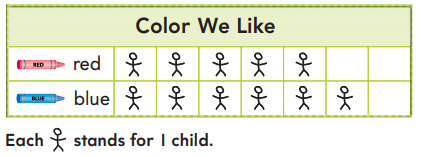
Question 1.
How many children chose ![]() ?
?
![]()
Answer:
Number of children chose ![]() = 5
= 5
Question 2.
Is the sentence true? Choose Yes or No.

Answer:

Explanation :
Number of children like blue = 6
Number of children like red = 5
Number of more children like blue than red = 6 – 1 = 1
Question 3.
1 more child gets a ![]() . Draw what the blue row looks like now.
. Draw what the blue row looks like now.

Answer:
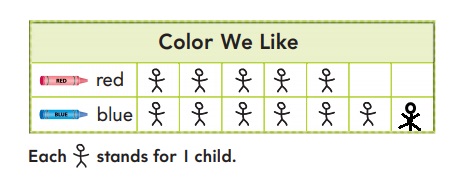
Now the blue rows gets fill completely .
Number of children like blue crayons = 7
Use the bar graph to answer the questions.
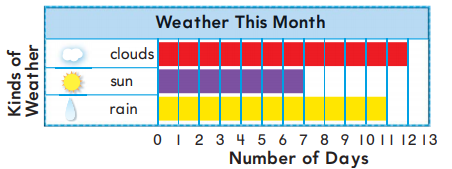
Question 4.
How many days had ![]() ?
?
![]()
Answer:
Number of days with ![]() = 7
= 7
Question 5.
Compare ![]() days. Circle the number that makes the sentence true.
days. Circle the number that makes the sentence true.

Answer:
4 days

Explanation :
Number of ![]() days = 11
days = 11
Number of days with ![]() = 7
= 7
Number of more ![]() days than
days than ![]() = 11 – 7 = 4 days
= 11 – 7 = 4 days
Question 6.
Ann says the graph shows 1 more rainy day than cloudy days. Is she correct?
Choose Yes or No.
Yes
No
Explain your answer
Answer:
No,
Explanation :
Number of cloudy days = 12
Number of rainy days = 11
Number of cloudy days are more
So, it should be one more cloudy day than rainy day .
Use the tally chart to answer the questions.
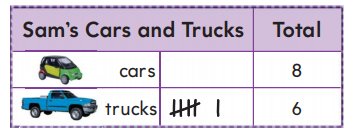
Question 7.
How many  does Sam have?
![]()
Answer:
Number of  =6
=6
Question 8.
Draw tally marks for the number of cars that the chart shows.
Answer:
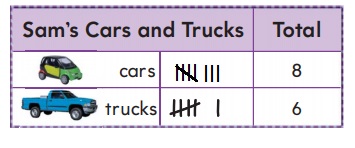
Question 9.
Circle the words that make the sentence true.

Answer:

Explanation :
Number of trucks = 6
Number of cars = 8
Number of cars are greater than number of trucks
Question 10.
THINK SMARTER+
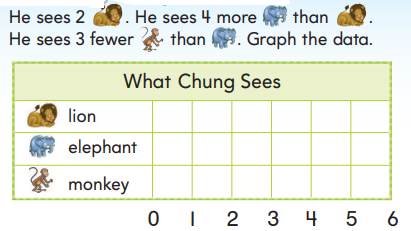
Chung visits the zoo.
Answer:
Number of lions seen = 2
Number of elephants seen = 4 + 2 = 6
Number of monkeys = 6 – 3 = 3
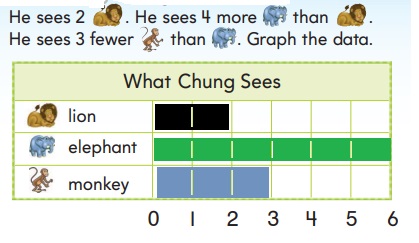
Use Chung’s graph to answer the question.
Question 11.
GO DEEPER
How many more ![]() does Chung see than
does Chung see than ![]() altogether?
altogether?
______
Answer:
1 more elephant
Explanation :
Number of lions seen = 2
Number of elephants seen = 4 + 2 = 6
Number of monkeys = 6 – 3 = 3
Number of lions and monkeys = 2 + 3 = 5
Number of more elephants than lions and monkeys altogether = 6 – 5 = 1
Question 12.
Write another question that can be answered by Chung’s graph.
Answer:
How many more animals seen elephants or lions:
Answer :
Elephants
Explanation :
Number of lions seen = 2
Number of elephants seen = 4 + 2 = 6
elephants are seen more
