Refer to our Texas Go Math Grade 8 Answer Key Pdf to score good marks in the exams. Test yourself by practicing the problems from Texas Go Math Grade 8 Module 4 Quiz Answer Key.
Texas Go Math Grade 8 Module 4 Quiz Answer Key
Texas Go Math Grade 8 Module 4 Ready to Go On? Answer Key
4.1 Representing Linear Nonproportional Relationships
Question 1.
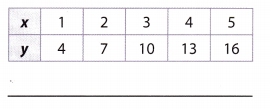
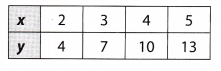
Complete the table using the equation y = 3x + 2.
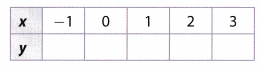
Answer:
In the given equation y = 3x + 2 include the given values of x.
x1 = -1 → y = 3 • (-1) + 2 = -3 + 2 → y = -1
x2 = 0 → y = 3 • 0 + 2 = 0 + 2 → y1 = 2
x3 = 1 → y = 3 • 1 + 2 = 3 + 2 → y1 = 5
x4 = 2 → y = 3 • 2 + 2 = 6 + 2 → y1 = 8
x5 = 3 → y = 3 • 3 + 2 = 9 + 2 → y1 = 11
Obtained values of y put in the tabla
4.2 Determining Slope and y-intercept
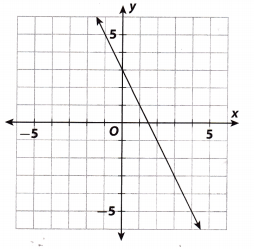
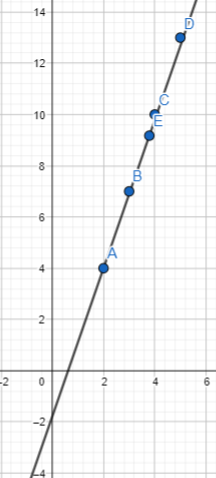
Question 2.
Find the slope and y-intercept of the line in the graph.
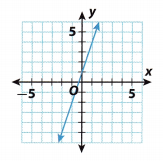
Answer:
The following equation for finding the slope and y-intercept is y = mx + b
The slope presents the ‘m’ in the equation, and the y-intercept represents b
The slope is calculated by:
m = \(\frac{y_{2}-y_{1}}{x_{2}-x_{1}}\)
From the given graph, find two points that will help you calculate the slope.
I’ll take (0, 1) for (x1, y1) and (1, 4) for (x2, y2).
Thus: m = \(\frac{4-1}{1-0}\) = \(\frac{43}{1}\) = 3
To find the y-intercept, we need to include values of x and y from one of these two points, and include the obtained slope. So:
y = mx + b
1 = 3 . 0 + b
1 = 0 + b
b = 1
m = 3, b = 1
4.3 Graphing Linear Nonproportional Relationships
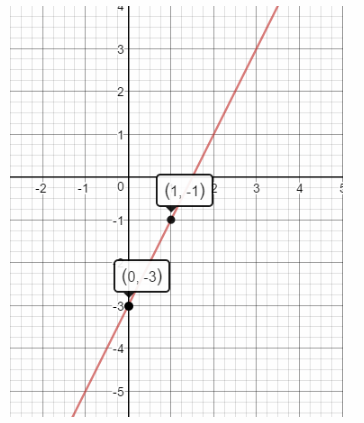
Question 3.
Graph the equation y = 2x – 3 using slope and y-intercept.
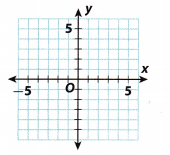
Answer:
y = 2x – 3
Slope = 2
y – intercept = -3
Plot the point that contains the y-intercept:
(0, -3)
The slope is m = \(\frac{2}{1}\)
Use the slope to find a second point.
From (0, -3) count $2$ unit up and $1$ unit right. The new point is (1, -1)
Draw a line through the points
4.4 Proportional and Nonproportional Situations
Question 4.
Does the table represent a proportional or a nonproportional linear relationship?
Answer:
To see if some linear relationship is proportional or nonproportional, we have to use ratio \(\frac{y}{x}\), which needs to be constant for proportionality.
From the given table, we have values for x and y, so just put them into the calculation.
\(\frac{y}{x}\) = \(\frac{4}{1}\) = 4
= \(\frac{8}{2}\) = 4
= \(\frac{12}{3}\) = 4
= \(\frac{16}{4}\) = 4
= \(\frac{20}{5}\) = 4
Thus, the obtained values are constant so this table represents a proportional relationship.
4.5 Solving Systems of Linear Equations by Graphing
Question 5.
A school band ordered hats for $3 and large T-shirts for $5. They bought 150 items in all for $590. Graph a system of equations to find how many hats and T-shirts the band ordered.
____________
Answer:
The graph represents the nonproportional relationship because the obtained b, ie y-intercept, is bigger than 0 (b /
= 0) and the line does not pass the origin. When the b = 0 and the line pass the origin, the linear relationship is proportional.
Essential Question
Question 6.
How can you identify a linear nonproportional relationship from a table, a graph, and an equation?
Answer:
The graph represents the nonproportional reLationship because the b, i.e. y-intercept from the given equation, is
bigger than 0 (b ≠ 0) and the line does not pass the origin. When the b = 0 and the line pass the origin, the linear relationship is proportional.
Texas Go Math Grade 8 Module 4 Mixed Review Texas Test Prep Answer Key
Selected Response
Question 1.
The table below represents which equation?
(A) y = -x – 10
(B) y = -6x
(C) y = 4x – 6
(D) y = -4x + 2
Answer:
(C) y = 4x – 6
Explanation:
The table is represented by Option C From the table, you can see that the y-intercept (when x = 0) is b = -6. Comparable to y = mx + b
y = 4x – 6
Question 2.
The graph of which equation is shown below?
(A) y = -2x + 3
(B) y = -2x + 1.5
(C) y = 2x + 3
(D) y = 2x + 1.5
Answer:
(A) y = -2x + 3
Explanation:
Option C is rejected
Since the graph is slanting downwards, the slope is negative.
The graph represents
y = -2x + 3
Question 3.
The table below represents a linear relationship.
What is the y-intercept?
(A) -4
(B) -2
(C) 2
(D) 3
Answer:
The y-intercept is -2.
Option B is the correct answer.
Question 4.
Which equation represents a nonproportional relationship?
(A) y = 3x + 0
(B) y = -3x
(C) y = 3x + 5
(D) y = \(\frac{1}{3}\)x
Answer:
(C) y = 3x + 5
Explanation:
Option C represents a non-proportional relationship
y = 3x + 5
For a non-proportional relationship, the equation is y = mx + b and b ≠ 0.
Question 5.
Which statement describes the solution of a system of linear equations for two lines with the same slope and the same y-intercept?
(A) one nonzero solution
(B) infinitely many solutions
(C) no solution
(D) solution of 0
Answer:
(B) infinitely many solutions
Gridded Response
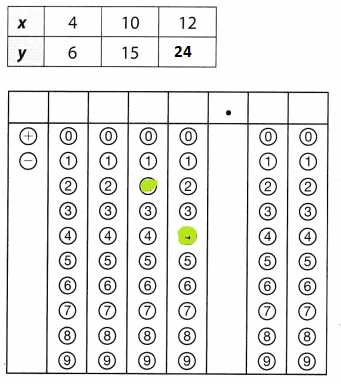
Question 6.
The table shows a proportional relationship. What is the missing y-value?
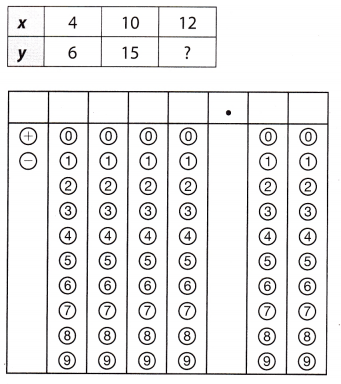
Answer: