Refer to our Texas Go Math Grade 8 Answer Key Pdf to score good marks in the exams. Test yourself by practicing the problems from Texas Go Math Grade 8 Lesson 6.2 Answer Key Describing Functions.
Texas Go Math Grade 8 Lesson 6.2 Answer Key Describing Functions
Essential Question
What are some characteristics that you can use to describe functions?
Texas Go Math Grade 8 Lesson 6.2 Explore Activity Answer Key
Investigating a Constant Rate of Change
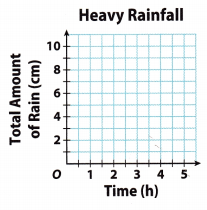
The U.S. Department of Agriculture defines heavy rain as rain that falls at a rate of 1.5 centimeters per hour.
A. The table shows the total amount of rain that falls in various amounts of time during a heavy rain. Complete the table.

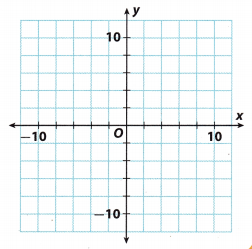
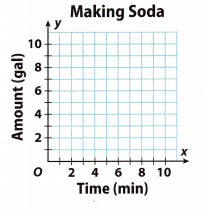
B. Plot the ordered pairs from the table on the coordinate plane at the right.
C. How much rain falls in 3.5 hours? ___
D. Plot the point corresponding to 3.5 hours of heavy rain.
E. What do you notice about all of the points you plotted?
F. Is the total amount of rain that falls a function of the number of hours that rain has been falling? Why or why not?
Reflect
Question 1.
Suppose you continued to plot points for times between those in the table, such as 1.2 hours or 4.5 hours. What can you say about the locations of these points?
Answer:
These points will lie on the straight line of graph of the data.
Your Turn
Question 2.
State whether the relationship between x and y in y = 0.5x is proportional or nonproportional. Then graph the function.
Answer:
y = 0.5x Given
Proportional relationship Compare the equation with the general linear equation y = mx + b. Since b = 0, the relationship is proportional
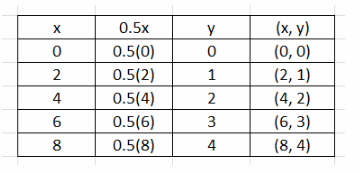
Choose several values for the input x. Substitute these values of x in the equation to find the output y.
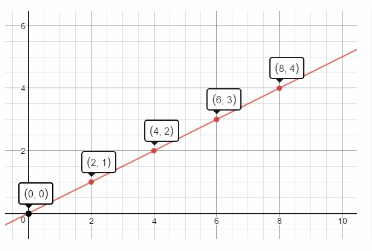
Graph the ordered pairs. Then draw a line through the points to represent the solution.
Your Turn
Question 3.
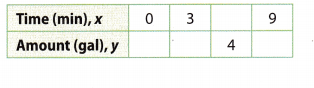
A soda machine makes \(\frac{2}{3}\) gallon of soda every minute. The total amount y that the machine makes in x minutes is given by the equation y = \(\frac{2}{3}\)x. Use the table and graph to determine whether the relationship between x and y is linear and, if so, if it is proportional.
Answer:
First, we compare the equation with the, general linear equation y = mx + b. y = \(\frac{2}{3}\)x is in the form y = mx + b, with m = \(\frac{2}{3}\) and b = 0. Therefore the equation is a linear equation. Since b = 0, the relationship is proportional.
Then we choose several values for the input x. We substitute these values of x in the equation to find the output y.
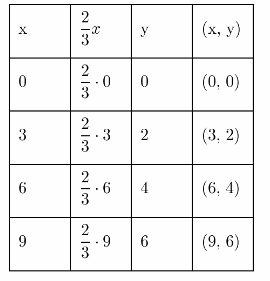
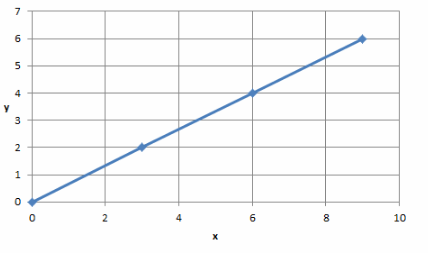
We graph the ordered pairs and we draw a line through the points to represent the solutions of the function.
Texas Go Math Grade 8 Lesson 6.2 Guided Practice Answer Key
Plot the ordered pairs from the table. Then graph the function represented by the ordered pairs and tell whether the function is linear or nonlinear. Tell whether the function is proportional. (Examples 1 and 2)
Question 1.
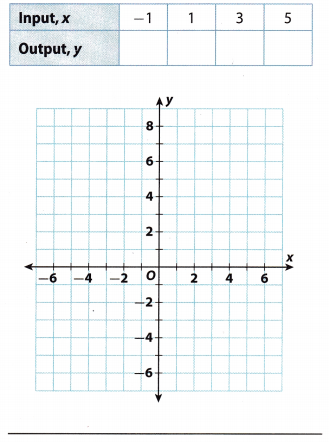
y = 5 – 2x
Answer:
y = 5 – 2x
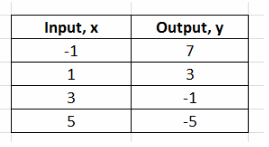
Complete the table
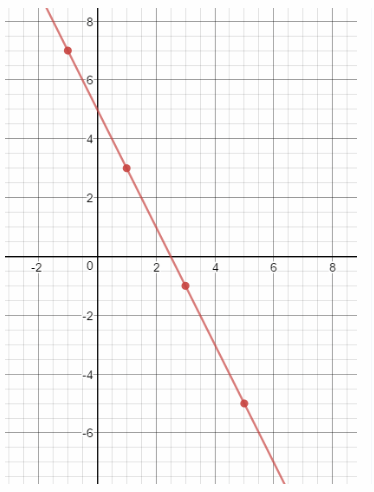
Graph the ordered pairs. Then draw a line through the points to represent the solution.
Linear relationship Graph of a Linear function is a straight line
Question 2.
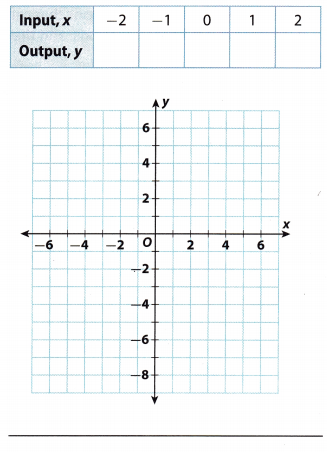
y = 2 – x2
Answer:
y = 2 – x2 Given
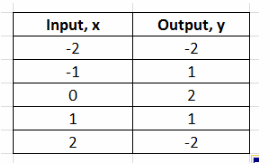
Complete the table
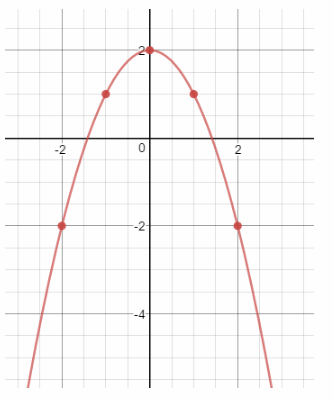
Graph the ordered pairs. Then draw a line through the points to represent the solution.
Non linear relationship Graph of a Linear function is a straight line
Explain whether each equation is a linear equation. (Example 2)
Question 3.
y = x2 – 1
Answer:
y = x2 – 1
Insert several vaLues for X:
x = 2
y = 22 – 1 (Substitute the given value of x for x)
= 4 – 1 (Simplify)
= 3 (Subtract)
x = 3
y = 32 – 1 (Substitute the given value of x for x)
= 9 – 1 (Simplify)
= 8 (Subtract)
x = 4
y = 42 – 1 (Substitute the given value of x for x)
= 16 – 1 (Simplify)
= 15 (Subtract)
The rate of change is not constant, so equation is non-linear.
Non-linear
Question 4.
y = 1 – x
Answer:
y = 1 – x Given
The equation is in the form of linear equation, hence is a linear equation.
Compare the equation with the general linear equation y = mx + b.
Essential Question Check-In
Question 5.
Explain how you can use a table of values, an equation, and a graph to determine whether a function represents a proportional relationship.
Answer:
From a table, determine the ratio \(\frac{y}{x}\). If it is constant the relationship is proportional.
From a graph, note if the graph passes through the origin. The graph of proportional relationship must pass through the origin (0, 0).
From an equation, compare with general linear form of equation, y = mx + b. If b = 0, the relationship is proportional.
Texas Go Math Grade 8 Lesson 6.2 Independent Practice Answer Key
Question 6.
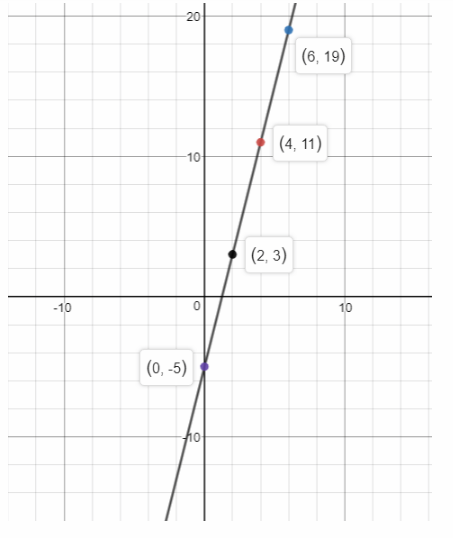
State whether the relationship between x and y in y = 4x – 5 is proportional or nonproportional. Then graph the function.
Answer:
First, we compare the equation with the general linear equation y = mx + b. y = 4x – 5 is in the form y = mx + b, with m = 4 and b = -5. Therefore, the equation is a linear equation. Since b ≠ 0, the relationship is non-proportional.
Then, we choose several values for the input x. We substitute these values of x in the equation to find the output y.
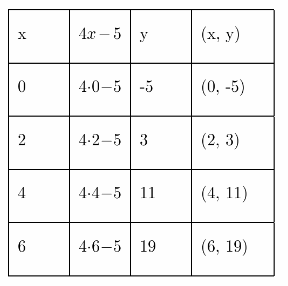
We graph the ordered pairs and we draw a line through the points to represent the solutions of the function.
Question 7.
The Fortaleza telescope in Brazil is a radio telescope. Its shape can be approximated with the equation y = 0.01 3x2. Is the relationship between x and y linear? Is it proportional? Explain.
Answer:
The linear function has the form y = mx + b, where m and b are real numbers. Every equation in the form of y = mx + b is a linear equation. Equations that cannot be written in this form is not linear equations and not linear functions.
Given the equation y = 0.013x2, we can definitely say that the relationship of x and y is not linear because the equation is not in the form of y = mx + b. As we can see, in the given equation there is variable x that is being raised to the 2 power or simply x2 which is not noticeable in the form of linear equation y = mx + b. So, it is not linear.
Since the given is not a linear equation, we cannot identify having proportional or nonproportional relationship, then the equation is not proportional
Question 8.
Kiley spent $20 on rides and snacks at the state fair. If x is the amount she spent on rides, and y is the amount she spent on snacks, the total amount she spent can be represented by the equation x + y = 20. Is the relationship between x and y linear? Is it proportional? Explain.
Answer:
owen
x + y = 20 Given
y = -x + 20 Rewriting the equation
It is linear Compare the equation with the general linear equation y = mx + b.
It is not proportional Since b ≠ 0, the relationship is not proportionaL
Question 9.
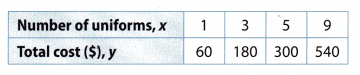
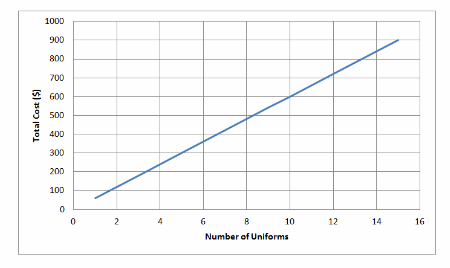
Represent Real-World Problems The drill team is buying new uniforms. The table shows y, the total cost in dollars, and x, the number of uniforms purchased.
a. Use the data to draw a graph. Is the relationship between x and y linear? Explain.
Answer:
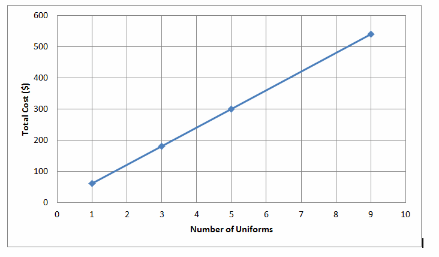
Draw the graph
x and y are linear Graph of a linear relationship is a straight line.
b. Use your graph to predict the cost of purchasing 12 uniforms.
Answer:
The cost of 12 uniforms is $720
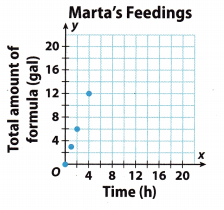
Question 10.
Marta, a whale calf in an aquarium, is fed a special milk formula. Her handler uses a graph to track the number of gallons of formula y the calf drinks in x hours. Is the relationship between x and y linear? Is it proportional? Explain.
Answer:
The relationship is linear The data lies on a straight line
The relationship is proportional. The graph passes through the origin
Question 11.
Critique Reasoning A student claims that the equation y = 7 is not a linear equation because it does not have the form y = mx + b. Do you agree or disagree? Why?
Answer:
Disagree The equation can be written in the form y = mx + b where m is 0. The graph of the solutions is a horizontal line.

Question 12.
Make a Prediction Let x represent the number of hours you read a book and y represent the total number of pages you have read. You have already read 70 pages and can read 30 pages per hour. Write an equation relating x hours and y pages you read. Then predict the total number of pages you will have read after another 3 hours.
Answer:
In the problem, the number of pages you have read already which is 70 pages and you can read 30 pages per hour, let us determine the equation relating x hours and y pages you read. Also let us predict the total number of pages you will have read after another 3 hours.
Representation:
Let x be the number of hours you read a book
y be the number of pages you have read
m be the number of pages per x hours
b be the number of pages you have read already
To determine the equation, let us apply the slope-intercept form y = mx + b. By using the representation, we can
formulate the equation given m = 30 and b = 70, that is y = 30x + 70
Now, Let us predict the total number of pages you wiLl have read after another 3 hours. Using the equation y =
30x + 70, substitute the 3 as the value of x.
y = 30x + 70
y = 30(3) + 70
y = 90 + 70
y = 160
Thus, the number of pages you will have read after another 3 hours is 160 pages.
y = 30x + 70; 160 pages
Texas Go Math Grade 8 Lesson 6.2 H.O.T. Focus On Higher Order Thinking Answer Key
Question 13.
Draw Conclusions Rebecca draws a graph of a real-world relationship that turns out to be a set of unconnected points. Can the relationship be linear? Can it be proportional? Explain your reasoning.
Answer:
The relationship is linear if all, the points lie on the same line.
If the relationship is linear and passes through the origin, it is proportional.
Question 14.
Communicate Mathematical Ideas Write a real-world problem involving a proportional relationship. Explain how you know the relationship is proportional.
Answer:
The amount of money earned at a car wash is proportional relationship. When there is 0 cars washed, $0 are earned. The amount of money earned increases by the unit cost of car wash.
Question 15.
Justify Reasoning Show that the equation y + 3 = 3(2x + 1) is linear and that it represents a proportional relationship between x and y.
Answer:
y + 3 = 3(2x + 1) Given
y + 3 = 6x + 3 Simplify using distributive property
y + 3 – 3 = 6x + 3 – 3 Subtract 3 from each side
y = 6x
Compare with the general linear equation y = mx + b
Proportional Since b = 0, it is a proportional relationship