Refer to our Texas Go Math Grade 8 Answer Key Pdf to score good marks in the exams. Test yourself by practicing the problems from Texas Go Math Grade 8 Lesson 4.1 Answer Key Representing Linear Nonproportional Relationships.
Texas Go Math Grade 8 Lesson 4.1 Answer Key Representing Linear Nonproportional Relationships
Essential Question
How can you use tables, graphs, and equations to represent linear nonproportional situations?
Your Turn
Question 1.
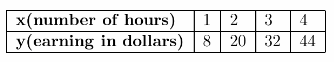
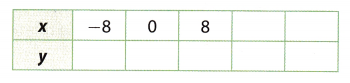
Francisco makes $12 per hour doing part-time work on Saturdays. He spends $4 on transportation to and from work. The equation y = 12x – 4 gives his earnings y, after transportation costs, for working x hours. Make
a table of values for this situation.
Answer:
Given equation y = 12x – 4.
Choose several values for x z and substitute in the equation.
Make a table.
How did we get values for y:
For x = 1 : y = 12 ∙ 1 – 4 = 8
For x = 2 : y = 12 ∙ 2 – 4 = 20
For x = 3: y = 12 ∙ 3 – 4 = 32
For x = 4 : y = 12 ∙ 4 – 4 = 44
Choose several values for x and substitute in the equation. Make a table.
Texas Go Math Grade 8 Lesson 4.1 Explore Activity Answer Key
Examining Linear Relationships
Recall that a proportional relationship is a relationship between two quantities in which the ratio of one quantity to the other quantity is constant. The graph of a proportional relationship is a line through the origin. Relationships can have a constant rate of change but not be proportional.
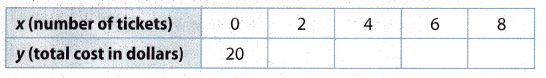
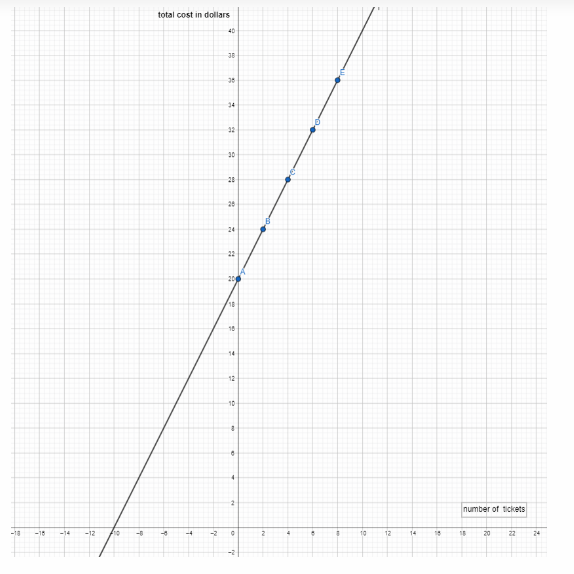
The entrance fee for Mountain World theme park is $20. Visitors purchase additional $2 tickets for rides, games, and food. The equation y = 2x +20 gives the total cost, y, to visit the park, including purchasing x tickets.
Step 1
Complete these exercises to review skills you will need for this chapter.
Step 2
Plot the ordered pairs from the table. Describe the shape of the graph.
Step 3
Find the rate of change between each point and the next. Is the rate constant?
Step 4
Calculate \(\frac{y}{x}\) for the values in the table. Explain why the relationship between number of tickets and total cost is not proportional.
Reflect
Question 2.
Analyze Relationships Would it make sense to add more points to the graph from x = 0 to x = 10? Would it make sense to connect the points with a line? Explain.
Answer:
The given equation is y = 2x + 20, which shows the proportion of the total cost and the number of additional
tickets.
To get the values for y, include the given values of x in the given equation.
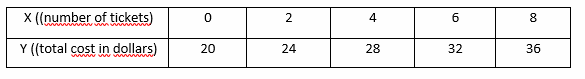
After entering the points on the graph, we get a straight line, which does not pass through the origin.
To find the rate of change between each point and the next one, we need to get the slope of the line. The
standard form of given equation is y = mx + b, so we are calculating the m (slope).
m = \(\frac{y_{2}-y_{1}}{x_{2}-x_{1}}\)
Look at the dots from the graph:
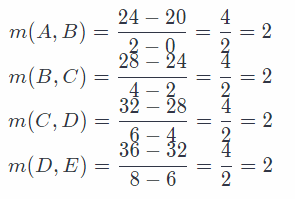
The rate is constant because the ratio between each and the next point is the same.
In the previous step, we have calculated the rate of change. The rate is constant, but the linear relationship is not proportional because the line does not pass through the origin.
Take a look at the standard form of the equation again: y = mx + b. when the b is not equal to 0, b ≠ 0, the linear
function won’t pass the origin on the graph.
Your Turn
Question 3.
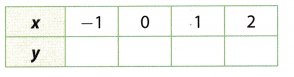
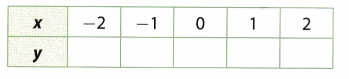
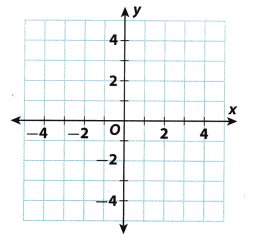
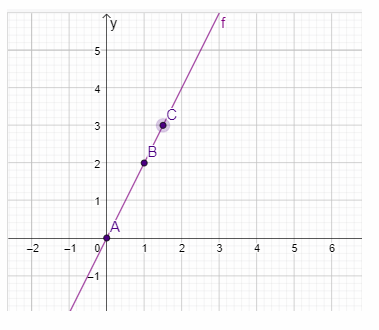
Make a table and graph the solutions of the equation y = -2x + 1.
Answer:
y = -2x + 1.
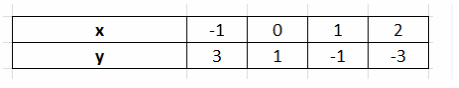
Choose several values for x and substitute in the equation to find y. Make a table.
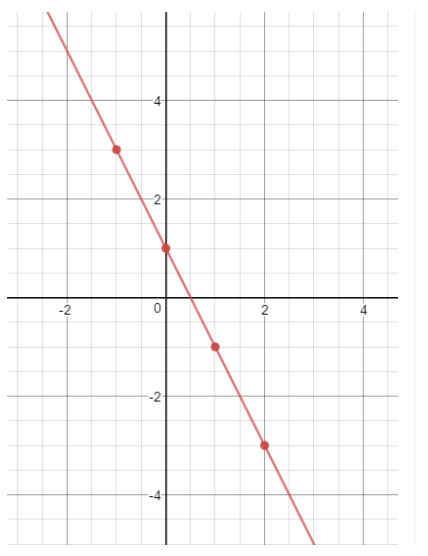
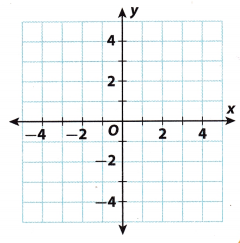
Plot the ordered pairs from the table. Then draw a line connecting the points to represent all the possible solutions.
Texas Go Math Grade 8 Lesson 4.1 Guided Practice Answer Key
Make a table of values for each equation. (Example 1)
Question 1.
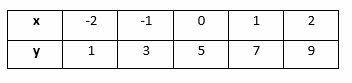
y = 2x + 5
Answer:
For the given equation y = 2x + 5, defaulted are values for x. To find the values for y, include the given values of x in the given equation.
Question 2.
y = \(\frac{3}{8}\)x – 5
Answer:
y = \(\frac{3}{8}\)x – 5 Given
Choose several values for x and substitute in the equation to find y. Make a table.
Explain why each relationship ¡s not proportional. (Explore Activity)
Question 3.
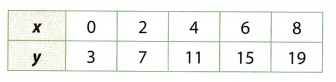
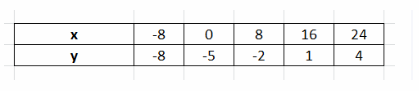
First calculate \(\frac{y}{x}\) for the values in the table.
Answer:
\(\frac{3}{0}\) = undefined Find \(\frac{y}{x}\)
\(\frac{7}{2}\) = 3.5
\(\frac{11}{4}\) = 2.75
\(\frac{15}{6}\) = 2.5
\(\frac{19}{8}\) = 2.375
The ratio is not constant, hence relationship is not proportional.
Question 4.
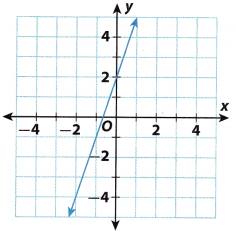
Answer:
The graph is a straight line but does not pass through the origin.
Complete the table for the equation. Then use the table to graph the equation. (Example 2)
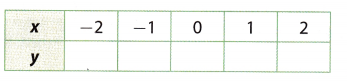
Question 5.
y = x – 1
Answer:
y = x – 1 Given
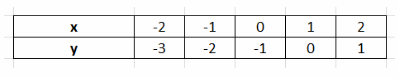 Choose several values for x and substitute in the equation to find y. Make a table.
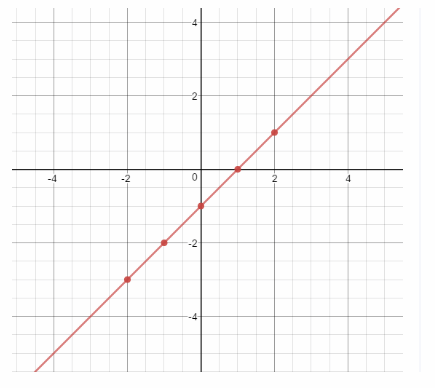
Plot the ordered pairs from the table. Then draw a line connecting the points to represent all the possible solutions.
Essential Question Check-In
Question 6.
How can you choose values for x when making a table of values representing a real world situation?
Answer:
When choosing values for x in a real world situation, you choose positive values with a appropriate interval to represent the array of data.
Texas Go Math Grade 8 Lesson 4.1 Independent Practice Answer Key
State whether the graph of each linear relationship is a solid line or a set of unconnected points. Explain your reasoning.
Question 7.
The relationship between the number of $4 lunches you buy with a $100 school lunch card and the money remaining on the card
Answer:
Each time you buy lunch the amount on the card will decrease by 4. This means that this function will be y = 100 – 4x, where x is the number of lunches and y remaining money.
For example:
When we buy one lunch (x = 1), we have 96 left.
That way we can only buy 25 lunches for 100.
The number x must be an integer because we cannot buy a fractional part of a lunch. So we have a set of unconnected points:{( 1, 96), (2, 92), …, (25, 0)}, not a solid line.
Set of unconnected points
Question 8.
The relationship between time and the distance remaining on a 3-mile walk for someone walking at a steady
rate of 2 miles per hour
Answer:
The person who is going to walk starts from the starting point 0. Thus, the first point on the graph is (0, 0), the starting point. The second thing we know is that a person has crossed 2 miLes in an hour, so that’s another point on the graph (1, 2).
Those data are based on the rate of steady walking.
Since the rate of steady walking is the same all the time, it is constant, and time can be measured in fraction, we can read the value for x on 3 miles (y) from the graph. → x = 1.5 = \(\frac{3}{2}\)
State of this graph of the linear relationship is a solid line.
Question 9.
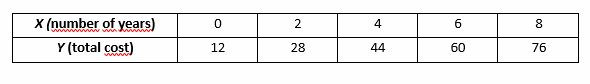
Analyze Relationships Simone paid $12 for an initial year’s subscription to a magazine. The renewal rate is $8 per year. This situation can be represented by the equation y = 8x + 12, where x represents the number of years the subscription is renewed and y represents the total cost.
a. Make a table of values for this situation.

Answer:
y = 8x + 12
to make a tabLe, we need to take some values for x, then include them into the equation y = 8x + 12 to get the values for y.
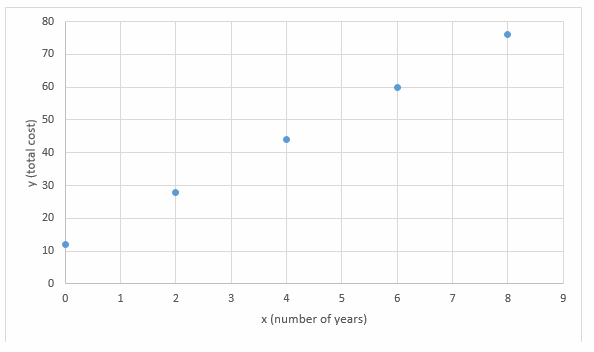
b. Draw a graph to represent the situation.
Answer:
enter to the graph obtained values of x and y
c) Explain why this relationship is not proportional.
Answer:
When the value of b is not equal to 0, b ≠ 0. the linear function does not pass through the origin. If the line does not pass the origin, the linear function is NON-proportional.
In our case b = 12 so it is not proportional.
d. Does it make sense to connect the points on the graph with a solid line? Explain.
Answer:
If we were to connect the obtained points on the graph, we would get a straight line, but that makes no sense.
The subscription works in a way that it is not possible to pay any amount other than $ 8 per year and it is not
possible to pay the subscription amount for just half a year or a few months. Any other point on the graph would
not be an actual indicator of the total cost.
Question 10.
Analyze Relationships A proportional relationship is a linear relationship because the rate of change is constant (and equal to the constant of proportionality). What is required of a proportional relationship that is not required of a general linear relationship?
Answer:
All proportional relationships are linear relationships, but all linear relationships are not proportional relationships. So, the only difference between those is b from the equation y = mx + b. The linear function is proportional if the b = 0 and passes through the Origin. If b ≠ 0, then it is non-proportional, but it is still linear.
Question 11.
Communicate Mathematical Ideas Explain how you can identify a linear nonproportional relationship from a table, a graph, and an equation.
Answer:
In a table, the ratios \(\frac{y}{x}\) will not be equal.
A graph will not pass through the origin.
An equation will be in the form y = mx + b where b ≠ 0
Texas Go Math Grade 8 Lesson 4.1 H.O.T. Focus On Higher Order Thinking Answer Key
Question 12.
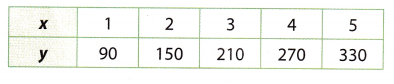
Critique Reasoning George observes that for every increase of 1 in the value of x, there is an increase of 60 in the corresponding value of y. He claims that the relationship represented by the table is proportional. Critique George’s reasoning.
Answer:
\(\frac{90}{1}\) = 90 Find \(\frac{y}{x}\)
\(\frac{150}{2}\) = 75
\(\frac{210}{3}\) = 70
\(\frac{270}{4}\) = 67.5
\(\frac{330}{5}\) = 66
The ratio is not constant, hence the relationship cannot be proportional.
Question 13.
Make a Conjecture Two parallel lines are graphed on a coordinate plane. How many of the lines could represent proportional relationships? Explain.
Answer:
The linear function can be proportional just if b = 0, and passes through the origin. If there are two lines on the
graph, just one can pass through the origin. Thus, if one line passes through the origin, the other one won’t, so just the ONE line can represent the proportional relationship.