Refer to our Texas Go Math Grade 8 Answer Key Pdf to score good marks in the exams. Test yourself by practicing the problems from Texas Go Math Grade 8 Lesson 15.2 Answer Key Generating Random Samples.
Texas Go Math Grade 8 Lesson 15.2 Answer Key Generating Random Samples
Texas Go Math Grade 8 Lesson 15.2 Explore Activity Answer Key
Explore Activity 1
Generating a Random Sample
When information is being gathered about a group, the entire group of objects, individuals, or events is called the population. A sample is part of the population chosen to represent the entire group.
A sample in which every person, object, or event has an equal chance of being selected is called a random sample. A random sample is more likely to be representative of the entire population than other sampling methods.
A store gets a shipment of 1000 light bulbs. Due to a manufacturing problem, 200 of the bulbs are defective, but the store’s manager is not aware of this. As she always does, however, the manager will check a sample of the bulbs to look for potential problems. How can she choose a sample of the bulbs to represent the shipment?
A. The manager will want to use a random sample to represent the entire shipment. One way to simulate a random sample is to use a graphing calculator to generate random integers.
To simulate picking out random light bulbs between 1 and 1000:
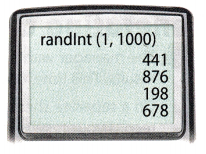
- Press MATH, scroll right and select PRB, then select 5: randlnt(.
- Enter the smallest value, comma, largest possible value.
- Hit ENTER to generate random numbers.
In this specific case, you will enter randlnt (______, __________) because there are __________ light bulbs in the shipment.
The numbers that are generated will each represent a bulb in the shipment. Because we know the numbers of defective and working bulbs, we can choose numbers to model the bulbs in the population.
Let numbers 1 to 200 represent bulbs that are ___________.
Numbers 201 to 1000 will represent bulbs that are ____________.
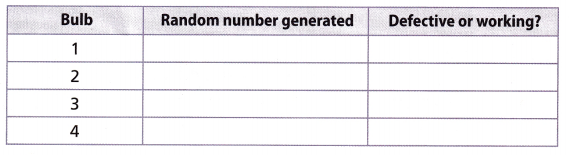
The manager has a calculator randomly select 4 integers to tell her which bulbs to check. To model this, generate four numbers and record them in the table below. Then tell whether each number represents a defective or a working bulb in the model.
B. If the manager’s sample matched your results, would it represent the population well? Explain.
Reflect
Question 1.
You and your classmates have generated multiple samples. Compare your results to those of your classmates. What do you notice?
Answer:
Question 2.
Communicate Mathematical Ideas Why did you and your classmates generate different answers for the number of defective light bulbs?
Answer:
Explore Activity 2
Generating a Larger Random Sample
A. The manager wants to use a larger random sample to get better results. This time, collect a sample of 20 light bulbs.
On a separate sheet of paper copy the table from Explore Activity 1 and record your results in the table. You will need rows for 20 light bulbs.
B. Does your new sample better represent the shipment than your original sample? Explain.
Reflect
Question 3.
You and your classmates have generated multiple samples. Compare your results to those of your classmates. What do you notice?
Answer:
Explore Activity 3
Generating a Random Sample without Technology
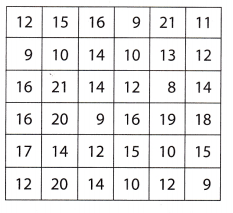
A tree farm has a 100 acre square field arranged in a 10-by-10 array. The farmer wants to know the average number of trees on each acre. Each cell in the table below represents an acre of land. The number in each cell tells how many trees grow on that particular acre.
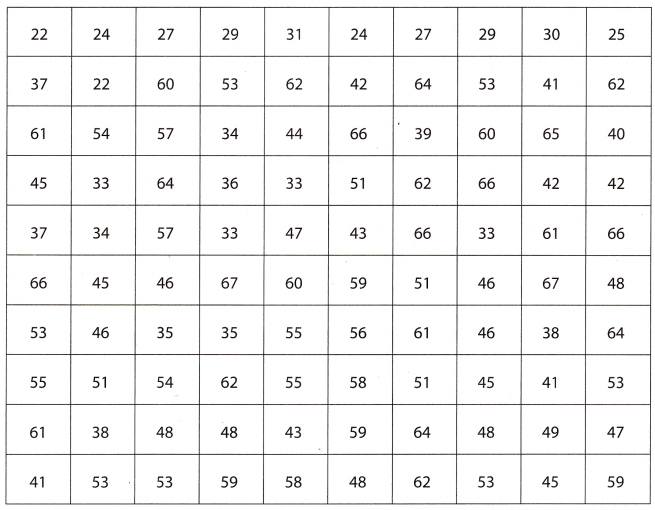
Because counting the trees on all of the acres is too time-consuming, the farmer decides to choose 10 acres at random and find the average number of trees.
A. To simulate the random selection, place this page on the floor. Drop 10 small objects onto the chart. Use these numbers for the 10 random acres.
B. What is the average number of trees on the 10 acres that were randomly selected?
C. Alternately, the farmer decides to choose the 10 acres in the first row. What is the average number of trees on these 10 acres?
Reflect
Question 4.
How do the averages you got with each sampling method compare?
Answer:
Question 5.
How do the averages you got with each sampling method compare to the average for the entire population, which is 48.4?
Answer:
Question 6.
Communicate Mathematical Ideas Why do you think the first method gave a closer average than the second method?
Answer:
Texas Go Math Grade 8 Lesson 15.2 Guided Practice Answer Key
Question 1.
A manufacturer gets a shipment of 600 batteries of which 50 are defective. The quality control manager tests a random sample of 30 batteries in each shipment. Simulate the test by generating random numbers between 1 and 600. How well does your sample represent the shipment? Explain. (Explore Activities 1 and 2)
Answer:
Question 2.
The farmer from Explore Activity 3 would like to have a better estimate of the number of trees per acre. This time, the farmer decides to choose 20 acres at random. Use the table to simulate the farmer’s random selection and find a new estimated average for the number of trees per acre. (Explore Activity 3)
Answer:
Essential Question Check-In
Question 3.
Why can data from a random sample be used to represent a population? What can happen if a sample is too small or not random?
Answer:
Texas Go Math Grade 8 Lesson 15.2 Independent Practice Answer Key
Maurie owns three bagel shops. Each shop sells 500 bagels per day. Maurie asks her store managers to use a random sample to see how many whole-wheat bagels are sold at each store each day. The results are shown in the table. Use the table for 4-6.
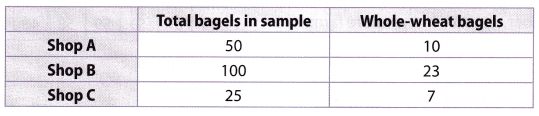
Question 4.
If you assume the samples are representative, how many whole-wheat bagels are sold at each store?
Answer:
Question 5.
Rank the samples for the shops in terms of how representative they are likely to be. Explain your rankings.
Answer:
Question 6.
Which sample or samples should Maurie use to tell her managers how many whole-wheat bagels to make each day? Explain.
Answer:
Question 7.
In a shipment of 1000 T-shirts, 75 do not meet quality standards. The store manager does not know this but always tests a random sample of each shipment. The table below simulates the manager’s random sample of 20 T-shirts to inspect. For the simulation, the integers 1 to 75 represent the below-standard shirts.
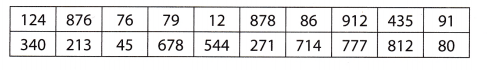
In the sample, how many of the shirts are below quality standards?
If the manager assumes his sample is representative and uses it to predict how many of the 1000 shirts are below standard, what will he conclude?
Answer:
Question 8.
Multistep A 64 acre coconut farm is arranged in an 8-by-8 array. Mika wants to know the average number of coconut palms on each acre. Each cell in the table represents an acre of land. The number in each cell tells how many coconut palms grow on that particular acre.
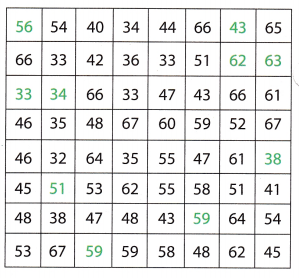
a. The numbers in green represent Mika’s random sample of 10 acres. What is the average number of coconut palms on the randomly selected acres?
Answer:
b. Project the number of palms in the entire farm.
Answer:
H.O.T. Focus on Higher Order Thinking
Question 9.
A random sample of 15 of the 78 competitors at a middle school gymnastics competition are asked their height. The data set lists the heights in inches: 55, 57, 57, 58, 59, 59, 59, 59, 59, 61,62, 62, 63, 64, 66. What is the mean height of the sample? Could you say this is a good estimate of the mean height of all competitors? Why or why not?
Answer:
Question 10.
Critical Thinking The six-by-six grid contains the ages of actors in a youth Shakespeare festival. Describe a method for randomly selecting 8 cells by using number cubes. Then calculate the average of the 8 values you found.
Answer:
Question 11.
Communicating Mathematical Ideas Describe how the size of a random sample affects how well it represents a population as a whole.
Answer: