Refer to our Texas Go Math Grade 7 Answer Key Pdf to score good marks in the exams. Test yourself by practicing the problems from Texas Go Math Grade 7 Lesson 12.3 Answer Key Comparing Populations.
Texas Go Math Grade 7 Lesson 12.3 Answer Key Comparing Populations
Texas Go Math Grade 7 Lesson 12.3 Explore Activity 1 Answer Key
Using Dot Plots to Compare Populations
You can compare two populations by taking a random sample of each population and comparing the samples using dot plots.
A test prep company gives its students a Pretest before the course and a Posttest after the course is completed. The test prep company picks a random sample of 10 students from each testing session.
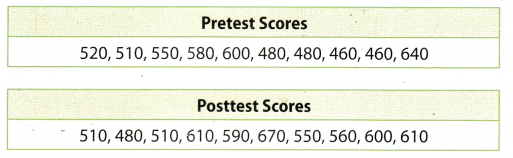
A. Make a dot plot for the sample of Pretest scores.
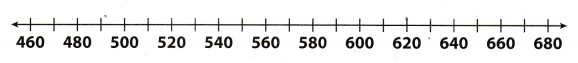
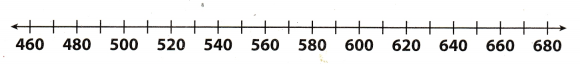
B. Make a dot plot for the sample of Posttest sores.
C. Compare the dot plots. The plots have a similar center/spread but the Posttest values are shifted to the _____.
Reflect
Question 1.
What can you infer about the populations by comparing the dot plots for the samples?
Answer:
Comparing the dot plots of both sample we get information :
- median of pretest score is 515 and the median of the posttest is 575. So the post-test score of the students are better than pretest score.
- Range of the pretest score is 640 – 460 = 10 and the range of posttest score is 670 — 480 = 190. So the data of posttest score are more spread.
- Mean of pretest score is 528 and the mean of posttest is 569.
Hence, we can say that Posttest scores of the students are better than the pretest score.
Median of pretest score is 515 and of posttest is 575.
Texas Go Math Grade 7 Lesson 12.3 Explore Activity 2 Answer Key
Using Box Plots to Compare Populations
You can also compare two populations using random samples and box plots.

A survey of 7th graders asks girls and boys how many baseball caps they own.
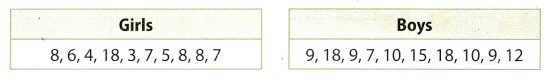
A) Make a box plot for the number of baseball caps girls own.
B) Make a box plot for the number of baseball caps boys own.
C) Compare the box plots.
The plot for boys has a lesser /greater range, but a lesser/greater interquartile range. The middle 50% of caps was less spread out for the _____.
Reflect
Question 2.
What can you infer about the populations by comparing the box plots for the samples? Justify your answer.
Answer:
Comparing the dot plots of both sample we get information:
- The median of girls is 7 and the median of the boys is 10. So the boys have more number of baseball caps as compared to girls.
- Range of the girls is 18 – 3 = 15 and the range of boys is 18 – 7 = 11. So the data of girls sample are more spread.
- Mean of pretest score is 7.4 and the mean of boys is 11.7. Hence, we can say that boys has more number of baseball caps as compared to girls baseball cap.
Median of girls is 7 and of boys it is 10.
Texas Go Math Grade 7 Lesson 12.3 Explore Activity 3 Answer Key
You can use the means and ranges of two random samples to compare the populations that the random samples represent.
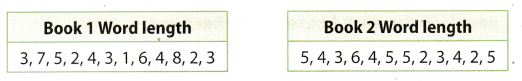
Paula and Daniel wanted to determine the average word length in two books. They took a random sample of 12 words each and counted the length of each word from each book.
Step 1
Calculate the mean for Book 1.
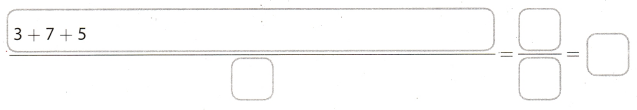
The mean for Book 1 is ______ letters long.
Step 2
Find the range for Book 1.
Subtract the least word length from the greatest word length.
Step 3
Calculate the mean for Book 2.
The mean for Book 2 is __ letters long.
Step 4
Find the range for Book 2.
___ + ___ = ____
Subtract the least word length from the greatest word length.
You can infer from the mean of each population that the overall average word length for Book 1 is less than/the same as/greater than the average word length for Book 2.
You can infer from the range of each population that the length of the words in Book 1 varies less than/in the same way as/more than
Reflect
Question 3.
What are the populations from which the samples were taken?
Answer:
It is given in problem that Paula and Daniel wants to determine the average world length in two books so they take random sample of 12 words from each book and count their length. Hence, here population will be all (each and every) the words in both the books, from where Paula and Daniel randomly selects 12 words to calculate average length.
Hence, population will be all the words in both the books.
Population will be all the words in both the books.
Texas Go Math Grade 7 Lesson 12.3 Guided Practice Answer Key
Carol wants to know how many people live in each household in her town. She conducts two random surveys of 10 people each and asks how many people live in their home. Her results are listed below. Use the data for 1 -6. (Explore Activities 1, 2 and 3)
Sample A: 1, 6, 2, 4, 4, 3, 5, 5, 2,8
Sample B: 3, 4, 5, 4, 3, 2, 4, 5, 4, 4
Question 1.
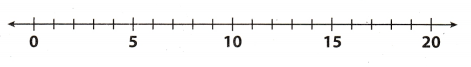
Make a dot plot for Sample A.
Answer:
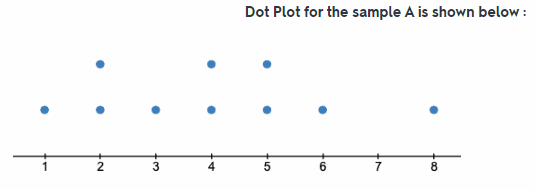
All the blue dot represent the sample.
Question 2.
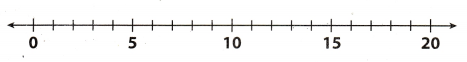
Make a dot plot for Sample B.
Answer:
All the red dot represent the sample.
Question 3.
Find the mean and range for Sample A.
Mean: ____ Range: _____
Answer:
Given sample A: 1, 6, 2, 4, 4, 3, 5, 5, 2, 8
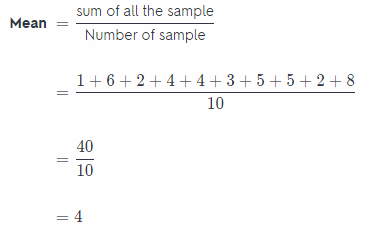
Range = Maximum value – Minimum vaLue
= 8 – 1
Mean : 4
Range: 7
Question 4.
Find the mean and range for Sample A.
Mean: ____ Range: _____
Answer:
Given sample A:3, 4, 5, 4, 3, 2, 4, 5, 4, 4
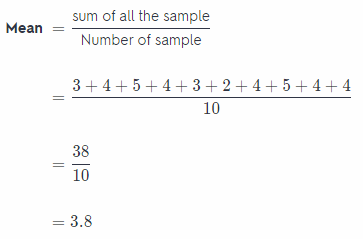
Range = Maximum value – Minimum value
= 5 – 2
= 3
Mean:3.8
Range:3
Question 5.
What can you infer about the population based on Sample A? Explain.
Answer:
After plotting the Dot Plot of sample A in question 1 we can observe that the dot plot is almost symmetrical about 4 which means that the mean of given sample A is 4. And also the maximum number of people who lives in household is 8 and the minimum number is 1. So the range is 8 – 1 = 7. In most of the cases the number of people who lives in household are 2, 4, or 5.
The mean (4) and the range (7) of sample A is greater as compared to the sample B.
Mean and range of sample A is greater than sample B.
Question 6.
What can you infer about the population based on Sample B? Explain.
Answer:
After plotting the Dot Plot of sample B in question 2 we can observe that the dot plot is almost symmetrical about 4 which means that the mean of given sample B is near by 4. And also the maximum number of people who lives in household is 5 and the minimum number is 2. So the range is 5 – 2 = 3. But in most of the cases the number of
people who lives in household are 4.
The mean (3.8) and the range (3) of sample B is smatter as compared to the sample B.
Mean and range of sample B is smaller than sample A
Essential Question Check-in
Question 7.
How can you use random samples to compare two populations?
Answer:
By using the random sample A and B we can conclude that:
- In case of sample A, there are exact 4 people in the household of maximum people whereas in case of sample B the maximum household has people less than 4. So average number of people living in household in both case is 4.
- Sample A has greater spread than Sample B which means that range of sample A is more than sample B. So number of people in household in sample A varies more rapidly than sample B.
By comparing the mean of random sample we can compare the average number of people in household in both cases.
Texas Go Math Grade 7 Lesson 12.3 Independent Practice Answer Key
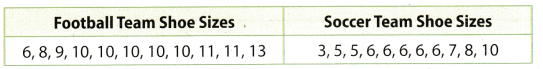
The high school is buying shoes for the boy’s football team and boy’s soccer team. The sizes of a random sample of the players’ feet is shown.
Question 8.
Find the mean for both lists. What can you infer about the populations by comparing the means?
Answer:
Sample of football team shoe size: 6, 8, 9, 10, 10, 10, 10, 10, 11, 13
Sample of soccer team shoe size: 3, 5, 5, 6, 6, 6, 6, 6, 7, 8, 10
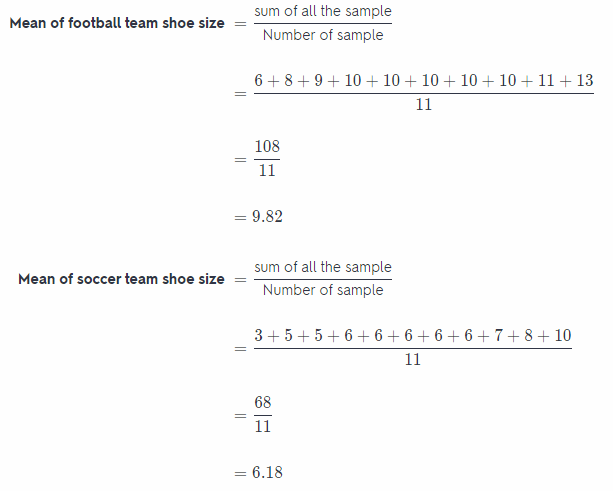
Average shoe size of team in case of football team is 9.82 but in case of soccer team the average shoe size of team 6.18.
Mean of football team is 9.82 and of soccer team is 6.18
Question 9.
Find the range of both lists. What can you infer about the populations by comparing the ranges?
Answer:
Sample of football team shoe size : 6, 8, 9, 10, 10, 10, 10, 10, 11, 13
Sample of soccer team shoe size: 3, 5, 5, 6, 6, 6, 6, 6, 7, 8, 10
Range of football team shoe size = Maximum value – Minimum value
= 13 – 6
= 7
Range of soccer team shoe size = Maximum value – Minimum value
= 10 – 3
= 7
Range of both football team and soccer team is same which is 7. This means that the spread of data (shoe size of both football and soccer team) are same in both case.
Range is same in both case.
Question 10.
Make a box plot for each sample.
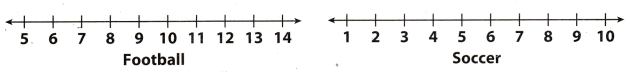
Answer:
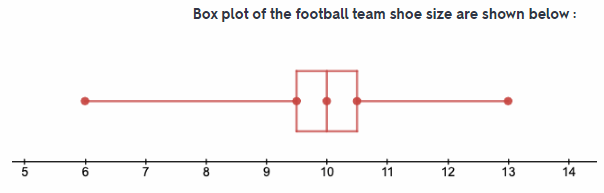
Box plot of both soccer and football team is shown.
Question 11.
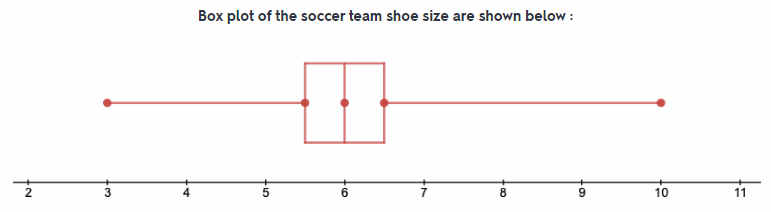
Draw Conclusions Compare the box plots. What do you notice from the visual comparison?
Answer:
On comparing the box plot of both the team we can collude that the size of box in both case are same. Also the the size of both the whisker is same which means the range are same. And the central line (Median) in case of football team is greater than the soccer team.
Size of whisker is same in both case.
Mrs. Garcia asked a random sample of her students the number of books they read over the summer. Use these data for 12-14.
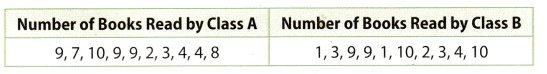
Question 12.
Make dot plots for each sample to illustrate the books read in each class.
Answer:
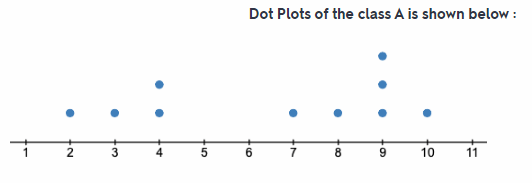
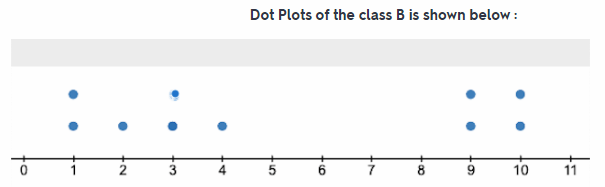
Maximum number of book read by both class A and Class B are 10
Question 13.
Describe two similarities and two differences between the dot plots.
Answer:
- Two similarities between the dot plot of class A and B are :
- In both the clot plot the maximum value or maximum number of b00k read is lo.
- Spread of data in b0th the dot plot are almost similar.
- Two differences between the dot plot of class A and B are
- Median of class A is 7.5 and class B is 3.5
- Minimum Number of book read by class A students is 1 but in case of class B students it is 2.
Median of class A is 7.5 and of class B is 3.5
Question 14.
Make a Conjecture Without doing any calculations, can you tell which class has read more books? Explain. What calculation would you perform to verify your response?
Answer:
Yes, we can tell which class has read more books without calculation.
By seeing the dot plot of both classes A and B we can say that class A has read more books than class B Because in the dot plot of class A the centre point (around which data are present) is between 7 and 8 but the dot plot of class B the centre point (around which data are present) is between 3 and 4.
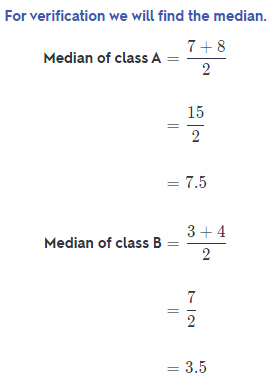
Median of class A is 7.5 and of class B is 3.5
Texas Go Math Grade 7 Lesson 12.3 H.O.T. Focus On Higher Order Thinking Answer Key
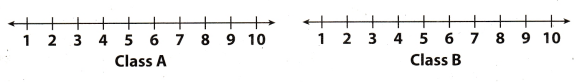
Question 15.
Communicate Mathematical Ideas Compare plotting points on a number line with plotting points on a dot plot.
Answer:
When any point is plotted on the number line, two variable x-coordinate and y-coordinate are needed and the y- coordinate of the point gives the value for corresponding value of x-coordinate. But in case of the dot plot each single dot represent the data from sample. If number of dot is more than one at single point then it means that data is repeated in the random sample
In dot plot each dot represent the data from random sample.
Question 16.
Analyze Relationships If you are given a box plot without any numbers on the number line, what can you tell about the data used to make the plot?
Answer:
Boxplot of any data tells or indicate that how the values of data from random sample are spread out. Box plot of any data indicate the median, range, maximum and minimum values of data sample. The box of box plot represent the upper and lower quartile of given data sample. So if boxplot is given without any numbers on number line we can only tells that how data from sample are distributed about the central point
If the whisker of boxplot is larger, this means that data is largely spread out from centre point but if whisker is very small or no whisker this means most of the data are near the central point.
Boxplot indicate median, range, max and min value of data sample.
Question 17.
Draw Conclusions Using at least ten points, create two distinct data sets with the same mean and range. Will their dot plots be the same? Could their box plots be the same?
Answer:
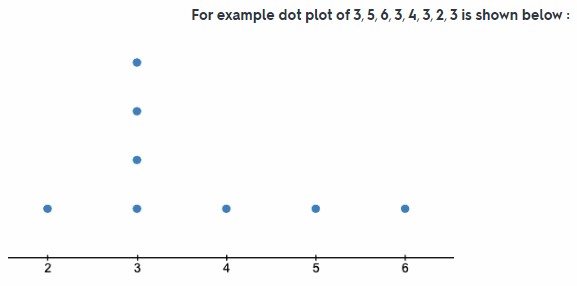
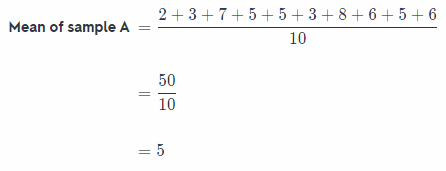
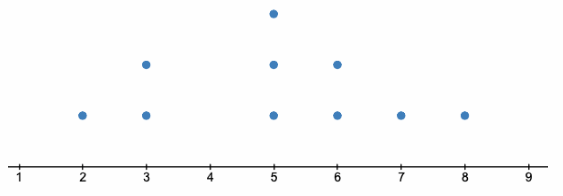
Let the first data sample be A: 2, 3, 7, 5, 5, 3, 8, 6, 5, 6
Range of sample A = Maximum value – Minimum value
= 8 – 2
= 6
Box plot of given data sample is shown below:
Let the first data sample be B: 4, 5, 4, 4, 5, 4, 4, 6, 4, 10
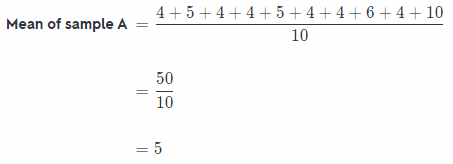
Range of sample A = Maximum value – Minimum value
= 10 – 4
= 6
Box plot of given data sample is shown below:
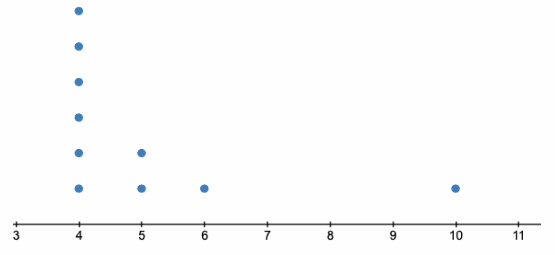
No, their dot plots cannot be same because dot plot depends on the value of data given in sample.
No their boxplot also cannot be same because the maximum and minimum values of given data are different in both the case.
No, their dot plots cannot be same.