Refer to our Texas Go Math Grade 7 Answer Key Pdf to score good marks in the exams. Test yourself by practicing the problems from Texas Go Math Grade 7 Lesson 12.2 Answer Key Making Inferences from a Random Samples.
Texas Go Math Grade 7 Lesson 12.2 Answer Key Making Inferences from a Random Samples
Texas Go Math Grade 7 Lesson 12.2 Explore Activity 1 Answer Key
Using Dot Plots to Make Inferences
After obtaining a random sample of a population, you can use statistical representations of the data from the sample, such as a dot plot or box plot, to make inferences about the population.
Rosee asked students on the lunch line how many books they had in their backpacks. She recorded the data as a list: 2, 6, 1, 0, 4, 1, 4, 2, 2. Make a dot plot for the books carried by this sample of students.
Step 1:
Order the data from least to greatest. Find the least and greatest values in the data set.
Step 2:
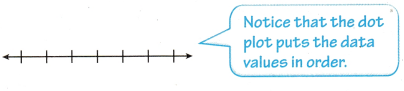
Draw a number line from 0 to 6. Place a dot above each number on the number line for each time it appears in the data set.
Reflect
Question 1.
How are the number of dots you plotted related to the number of data values?
Answer:
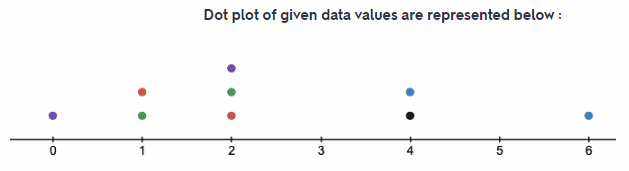
In above dot plot each dot represents a single student carrying that particular number of book. For example on number line at 2, the number of dot is three, this means that there are 3 students who have two books in their backpack. So simply we can say that number of dots represents the number of students.
Number of dots represent the number of students.
Question 2.
Complete each qualitative inference about the population.
Most students have _____________ 1 book in their backpacks.
Most students have fewer than ___________ books in their backpacks.
Most students have between _____________ books in their backpacks.
Answer:
Most students have at least 1 book in their backpacks.
Most students have fewer than six books in their backpacks.
Most students have between two to six books in their backpacks.
Most students have at least 1 book in their backpacks.
Question 3.
What could Rosee do to improve the quality of her data?
Answer:
The number of sample of students taken by Rosee is only nine which is very small as compared to the number of students in school. And we know that the accuracy of any data is directly proportional to number of data collected or size of the sample. So if the size of sample is large then the probability of common result is more.
Hence, to improve the quality of her data Rosee should increase the number of sample of students.
Rosee should increase the size of sample.
Rosee should increase the size of sample to improve quality of data.
Texas Go Math Grade 7 Lesson 12.2 Explore Activity 2 Answer Key
Using Box Plots to Make inferences
You ‘can also analyze box plots to make inferences about a population.
The number of pets owned by a random sample of students at Park Middle school is shown below. Use the data to make a box plot.
9, 2, 0, 4, 6, 3, 3, 2, 5
step 1:
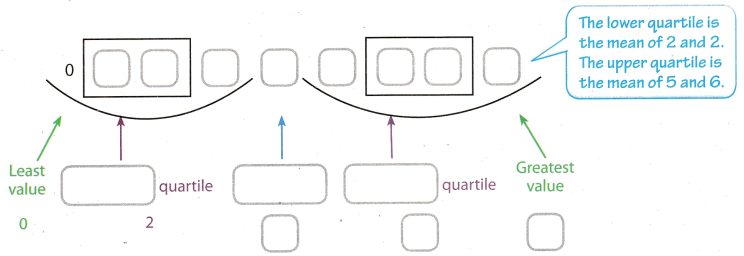
Order the data from least to greatest. Then find the least and greatest values, the median, and the lower and upper quartiles.
The lower and upper quartiles can be calculated by finding the medians of each “half” of the number line that includes all the data.
Step 2:
Draw a number line that includes all the data values.
Plot a point for each of the values found in Step 1.
Step 3:
Draw a box from the lower to upper quartile. Inside the box, draw a vertical line through the median. Finally, draw the whiskers by connecting the least and greatest values to the box.
Reflect
Question 4.
Complete each qualitative inference about the population.
A good measure for the most likely number of pets is _____
50% of the students have between ________ and 3 pets.
Almost every student in Parkview has at least _______________ pet.
Answer:
A good measure for the most likely number of pets is three because the median of the given data is 3
50% of the students have between 0 and 3 pets because out of all given data half of the data is between 0 to 1
Almost every students in Parkview has at least two pets because except 1 students everyone has at Least 2 pets.
Almost every students in Parkview has at least 2 pets.
Using Proportions to Make Inferences
A random sample has a good chance of being representative of the population. You can use data about the sample and proportional reasoning to make inferences or predictions about the population.
Example 1.
A shipment to a warehouse consists of 3,500 MP3 players. The manager chooses a random sample of 50 MP3 players and finds that 3 are defective. How many MP3 players in the shipment are likely to be defective?
Answer:
It is reasonable to make a prediction about the population because this sample is random.
Step 1
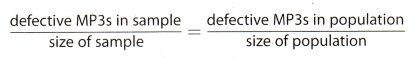
Set up a proportion.
Step 2
Substitute values into the proportion.
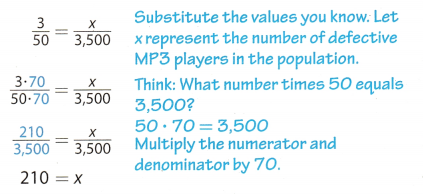
Based on the sample, you can predict that 210 MP3 players in the shipment would be defective.
Your Turn
Question 5.
What If? How many MP3 players in the shipment would you predict to be damaged if 6 MP3s in the sample had been damaged?
Answer:
Total number of MP3 player in warehouse = 3, 500
Number of MP3 player taken in random sample = 50
Number of damage MP3 player in random sample = 6
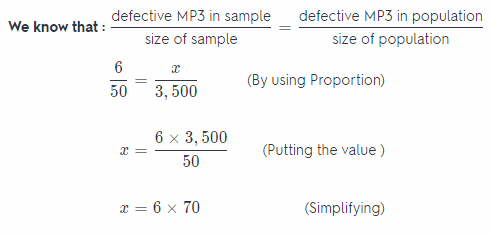
z = 420
Hence, we can predict that 420 MP3 pLayer would have been damaged.
we can predict that 420 MP3 player would have been damaged.
Reflect
Question 6.
How could you use estimation to check if your answer is reasonable?
Answer:
For checking answer in previous problem that it is reasonable or not we can use estimation. In problem it is given that there are total 3,500 MP3 player and the manager is choosing a sample of 50 MP3 players. This means that the number of sample will \(\frac{3,500}{50}\) = 70. And it is also given that in each sample 6 MP3 player are defective, so out of 50, 6 MP3 player are defective. Hence 70 sample the number of defective MP3 player will be 6 × 70 = 420. So the answer found in the previous problem is reasonable.
Number of defective MP3 player: 6 × 70 = 420
Texas Go Math Grade 7 Lesson 12.2 Guided Practice Answer Key
Patrons in the children’s section of a local branch library were randomly selected and asked their ages. The librarian wants to use the data to infer the ages of all patrons of the children’s section so he can select age appropriate activities. (Explore Activity 1 and 2)
7, 4, 7, 5, 4, 10, 11, 6, 7, 4
Question 1.
Make a dot plot of the sample population data.
Answer:
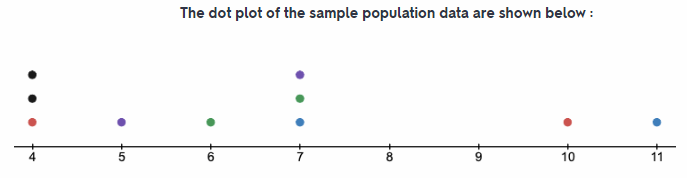
Number of children is represented by dots.
Question 2.
Make a box plot of the sample population data.
Answer:
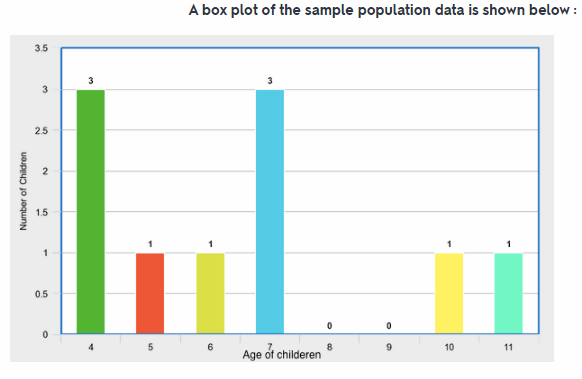
Box plot of sample population data is shown in different colour.
Question 3.
The most common age of children that use the library is ______ and _____.
Answer:
The most common age of the children that uses the library is four and seven. Because there are three students of age four and three students of age seven in local library out given sample which is ten number of students.
Question 4.
The range of ages of children that use the library is from _______ to ____.
Answer:
The range of ages of children that uses the library is from four to eleven. Because out the given sample (age of the students who are in local library) students with least age is 4 and the student with maximum age 11.
Question 5.
The median age of children that use the library is ____.
Answer:
Arranging the given data: 4, 4, 4, 5, 6, 7, 7, 7, 10, 11
So, here we can see that total number of sample is 10 which an even number. And the total number of sample is even then the median of sample is the average of two middle number.
Median of given sample will be the mean of 5th and 6th term.
Median = \(\frac{6+7}{2}\)
= \(\frac{13}{2}\)
= 6.5
The median age of children that use the library is 6.5
Question 6.
A manufacturer fills an order for 4,200 smart phones. The quality inspector selects a random sample of 60 phones and finds that 4 are defective. How many smart phones in the order are likely to be defective? (Example 1)
About ____ smart phones in the order are likely to be defective.
Answer:
Total number of smart phone ordered = 4,200
Number of smart phone random sample = 60
Number of defective smart phone in random sample = 4
defective smart phone in sample defective smart phone in population
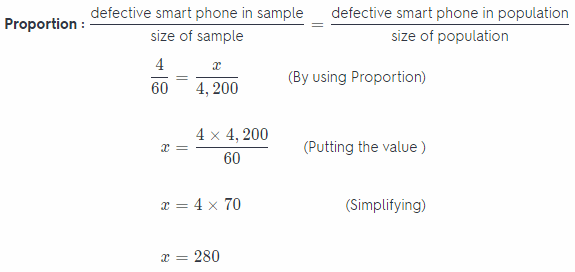
Hence, we can predict that 280 smart phone would have been defective.
About 280 smart phones in the order are likely to be defective.
Question 7.
Part of the population of 4,500 elk at a wildlife preserve is infected with a parasite. A random sample of 50 elk shows that 8 of them are infected.
How many elk are likely to be infected? (Example 1)
Answer:
Number of people at a wildlife = 4,500
Number of people in random sample = 50
Number of infected people in random sample = 8
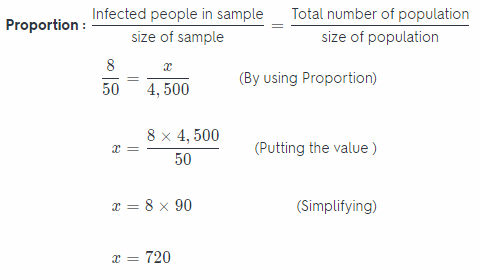
Hence, we can predict that 720 people would have been infected.
Essential Question Check-In
Question 8.
How can you use a random sample of a population to make predictions?
Answer:
A sample in which every person object or event has an equal chance off being selected is called as random sample. So random sample of population can used to make the predictions. For example there are 600 students in school. We went in canteen and asked the random sample of 60 students that how many books do they have in
their backpack. And the 15 students replied that they have 4 books. By using the proportional relation we can predict that out of 600 students in school \(\frac{15}{60}\) = \(\frac{x}{600}\) the number students with 4 books are x = 150. Hence in this way a random sample of a population is used to make predictions.
By proportion relation we can use random sample of population to make predictions.
Texas Go Math Grade 7 Lesson 12.2 Independent Practice Answer Key
Question 9.
A manager samples the receipts of every fifth person who goes through the line. Out of 50 people, 4 had a mispriced item. If 600 people go to this store each day, how many people would you expect to have a mispriced item?
Answer:
Total number of people going to store = 600
Number of people in random sample = 50
Number of people who have misplaced item = 4
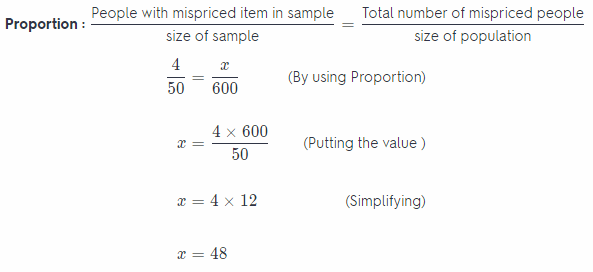
Hence, we can predict that 48 people have mispriced items.
Question 10.
Jerry randomly selects 20 boxes of crayons from the shelf and finds 2 boxes with at least one broken crayon. If the shelf holds 130 boxes, how many would you expect to have at least one broken crayon?
Answer:
Total number of crayons boxes on shelf = 130
Number of crayons boxes in random sample = 20
Number of boxes with broken crayons = 2
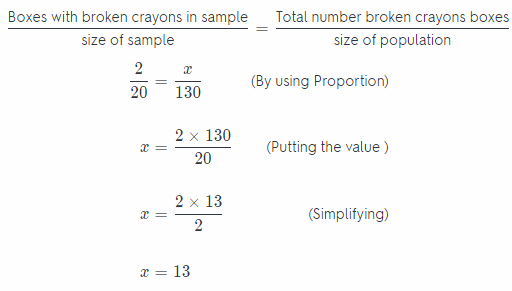
Hence, we can expect out of 130 crayons boxes 13 boxes are with broken crayons.
Question 11.
A random sample of dogs at different animal shelters in a city shows that 12 of the 60 dogs are puppies. The city’s animal shelters collectively house 1,200 dogs each year. About how many dogs in all of the city’s animal shelters are puppies?
Answer:
Total number of dogs in city’s animal shelter = 1, 200
Number of dogs which are puppies = 12
Number of dogs taken in sample = 60
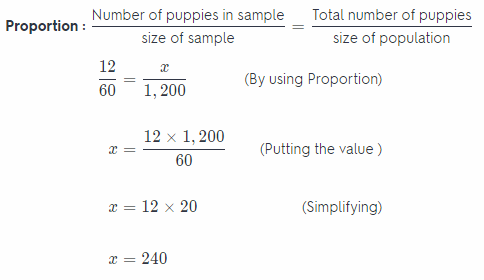
Hence, we can predict that out of 1,200 dogs 240 dogs may be puppies.
Question 12.
Part of the population of 10,800 hawks at a national park are building a nest. A random sample of 72 hawks shows that 12 of them are building a nest. Estimate the number of hawks building a nest in the population.
Answer:
Total number of hawks at national park = 10, 800
Number of hawks who are building nest = 12
Number of hawks taken in sample = 72
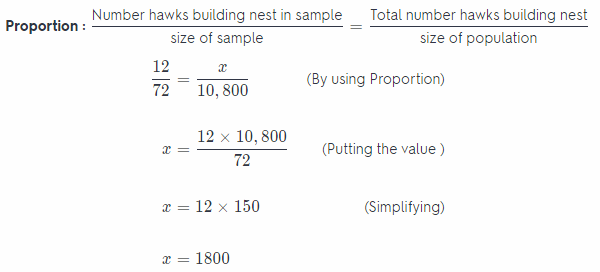
Hence, we can predict that out of 10,800 hawks, 1800 hawks building nest.
Question 13.
In a wildlife preserve a random sample of the population of 150 raccoons was caught and weighed. The results, given in pounds, were 17,19,20,21, 23,27,28, 28, 28 and 32. Jean made the qualitative statement, “The average weight of the raccoon population is 25 pounds.” Is her statement reasonable? Explain.
Answer:
In given problem the weight of att the 150 raccoons are not given so we cannot find the average weight of 150 raccons. But in problem the average weight of 150 raccoons is given 25 pound. So the best way to find the average weight will be finding the median of given 10 weights.
Arranging weight in increasing order: 17, 19, 20, 21, 23, 27, 28, 28, 28, & 32.
(Here we can see that total number of sample (arranged in increasing order) is 10 which an even number And we know that when number of terms is an even number then the median is average of the two middle term. So here median will be the average of 5th and 6th term.)
Median = \(\frac{23+27}{2}\)
= \(\frac{50}{2}\)
= 25
Hence, the median is 25 so, Jean’s statement is reasonable.
Question 14.
Greta collects the number of miles run each week from a random sample of female marathon runners. Her data is shown below. She made the qualitative statement, “25% of female marathoners run 13 or more miles a week.” Is her statement reasonable? Explain. Data: 13, 14, 18, 13, 12, 17, 15, 12, 13, 19, 11, 14, 14, 18, 22, 12
Answer:
Arranging miles in increasing order: 11, 12, 12, 12, 13, 13, 13, 14, 14, 14, 15, 17, 18, 18, 19, 22
Total number of random sample = 16
Number of sample which are 13 or more miles = 12
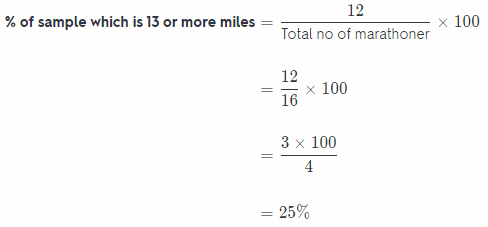
Hence, 75% of female marathoner runs 13 or more miles.
So, Greta’s statement is not reasonable as she said 25% of female marathoner runs 13 or more miles.
Question 15.
A random sample of 20 of the 200 students at Garland Elementary is asked how many siblings each has. The data was ordered as shown. Make a dot plot of the data. Then make a qualitative statement about the population. Data: 0, 1, 1, 1, 1, 1, 1, 2, 2, 2, 2, 2, 3, 3, 3, 3, 4, 4, 4, 6
Answer:
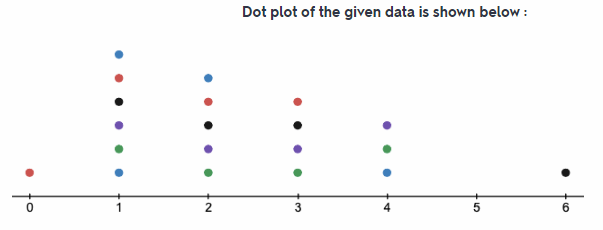
Every dot represent the number of students with that particular number of siblings. For example at “1” number of dot is 6, this means that there 6 students who have 1 sibling.
In above dot plot we can see that maximum dot are between 1 and 4. So maximum number of students have siblings between 1 to 4. And there is only one student who have no siblings and also one students have 6 siblings.
Maximum students have siblings between 1 and 4.
Question 16.
Linda collects a random sample of 12 of the 98 Wilderness Club members’ ages. She makes an inference that most wilderness dub members are between 20 and 40 years old. Describe what a box plot that would confirm Linda’s inference should look like.
Answer:
It is given in problem that the age of most of the club member are between 20 to 40 years. This means that maximum portion of boxplot of this data will be between 20 to 40. So the box of box plot data representation will entirety lie between the 20 and 40.
Box of boxplot will lie between 20 t0 40.
Question 17.
What’s the Error? Kudrey was making a box plot. He first plotted the least and greatest data values. He then divided the distance into half, and then did this again for each half. What did Kudrey do wrong and what did his box plot look like?
Answer:
Kudrey thought that the box will show equal quartiles by dividing the distance between the least and greatest data values into four. A box plot has five statistical summary of the data set which are the median, least and greatest values, and the lower and upper quartiles. It s easy to plot the least and greatest values. Kudrey should determine the median from the data set and plot it as well. The median divides the data into two halves After which, determine the quartiles by determining the median of the two halves, which will be the lower and upper quartiles, respectively
Kudrey thought that the box will show equal quartiles by dividing the distance between the least and greatest data values into four.
Texas Go Math Grade 7 Lesson 12.2 H.O.T. Focus on Higher Order Thinking Answer Key
Question 18.
Communicating Mathematical Ideas A dot plot includes all of the actual data values. Does a box plot include any of the actual data values?
Answer:
The median in the dot plot can be determined once calculated. The box plot can show some of the actual data values. These are the least and greatest data values and the median.
Least and greatest data values and the median
Question 19.
Make a Conjecture Sammy counted the peanuts in several packages of roasted peanuts. He found that the bags had 102, 114, 97, 85, 106, 120, 107, and 111 peanuts. Should he make a box plot or dot plot to represent the data? Explain your reasoning.
Answer:
Since the data set does not have any duplicates, a box plot is more applicable to represent the data. This is because the data values can be easily represented through a box plot. The box plot would show the five key values to represent a set of data. These are the least and greatest data values, the lower and upper quartiles, and the median. The interquartile range can also be determined through the use of the box plot
Question 20.
Represent Real-World Problems The salaries for the eight employees at a small company are $20,000, $20,000, $22,000, $24,000, $24,000, $29,000, $34,000 and $79,000. Make a qualitative inference about a typical salary at this company. Would an advertisement that stated that the average salary earned at the company is $31,500 be misleading? Explain.
Answer:
Evaluate the average salary front the given data, therefore:

Evaluate:
Average salary = 31,500
It can be seen that the average salary is evaluated to he $31,500 but the given data does not reveal so. This is because there is one outlier in this data set which is $79,000. if the average salary is evaluated by flot considering
this value, it will be:
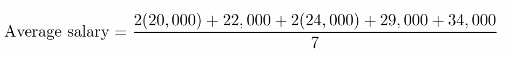
Evaluate:
Average salary = 24,714
This is a more accurate measure of the average salary. Therefore yes the advertisement stating that the average salary is $31,500 is misleading.
Yes the advertisement stating that the average salary is $31,500 is misleading because there is an outlier in the given data set, without which the average salary come out to be $24,714.