Refer to our Texas Go Math Grade 6 Answer Key Pdf to score good marks in the exams. Test yourself by practicing the problems from Texas Go Math Grade 6 Unit 6 Study Guide Review Answer Key.
Texas Go Math Grade 6 Unit 6 Study Guide Review Answer Key
Essential Question
How can you solve real-world problems by displaying, analyzing, and summarizing data?
Exercises
Question 1.
Find the mean and median of the data set: 4, 6, 2, 8, 14, 2. ________
Answer:
Determine the mean and median of the data.
mean = \(\frac{2+2+4+6+8+14}{6}\) get the sum of all, the values then divide by 6
= \(\frac{36}{6}\) simplify
= 6 mean of the data
median = \(\frac{4+6}{2}\) add the 4th and 5th vaLue then divide by 2
= \(\frac{10}{2}\) simplify
= 5 median of the data
The mean of the data is 6 while the median is 5.
Question 2.
The number of goals for the 13 players on a soccer team are 4, 9, 0, 1, 1, 2, 0, 0, 2, 8, 8, 3, 1. Find the median, lower quartile, and upper quartile. Then make a box plot for the data. (Lesson 17.2) _____
Answer:
Determine the median, lower quartile, and upper quartile.
0, 0, 0, 1, 1, 1, 2, 2, 3, 4, 8, 8, 9
- The median of the data is the 7th value which is 2.
- The lower quartile is the average of 4th and 5th value which is 0.5
- The upper quartile is the average of 10th and 11th value which is 6.
Box plot of the data
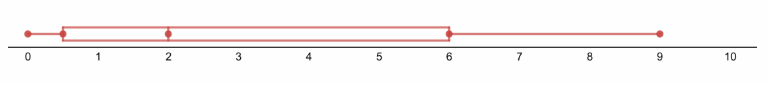
The mean of data is 2, the lower quartile is 0.5, and upper quartile is 6.
Question 3.
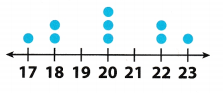
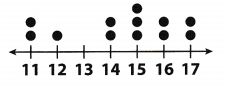
Use the dot plot to find the mean, median, and range of the data. (Lesson 1 7.3)
mean ___ median ________ range ____
Answer:
Determine the mean, median, and range.
mean = \(\frac{1(17)+2(18)+3(20)+2(22)+1(23)}{9}\) get the sum of all the values then divide by 9
= \(\frac{180}{9}\) simplify
= 20 mean of the data
median = 17, 18, 18, 20, 20, 20, 22, 22, 23 middle value of the data set
= 20 median of the data
range = 23 – 17 subtract the least value from the greatest value
= 6 range of the data
Mean = 20
Median = 20
Range = 6
Question 4.
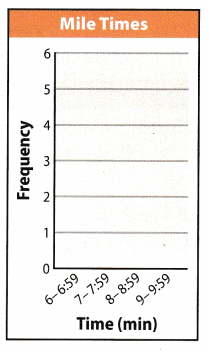
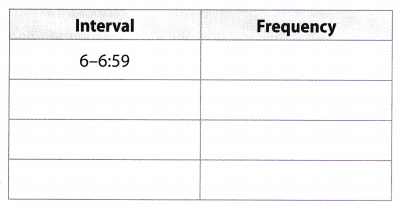
The coach recorded the time it took 14 students to run a mile. The times are as follows: 9:23, 8:15, 9:23, 9:01,6:45,6:55,7:20, 9:14,6:21, 7:12, 7:34, 6:10,9:15,9:18. (Lesson 17.4)
Use the data to complete the frequency table. Then use the table to make a histogram.
Answer:
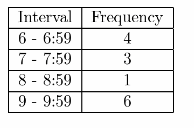
Histogram of the data
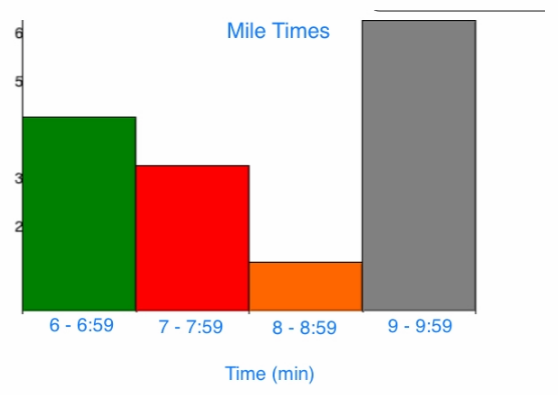
Frequency table and histogram of the recorded time.
Question 5.
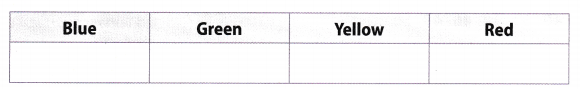
The 16 students in Mr. Wu’s algebra class took a survey on their favorite color. The results are shown in the frequency table. (Lesson 17.5)
Make a relative frequency table of the data that shows each data item as a fraction of the total and as a percent.
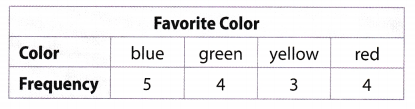
Answer:
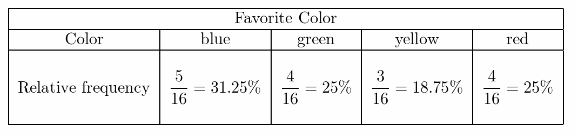
Relative frequency of the indicated data as shown on the table
Texas Go Math Grade 6 Unit 6 Performance Tasks Answer Key
Question 1.
CAREERS IN MATH Getici Kinesha collects data about the eye colors of the students in her science class.
a. Which measure or measures of center are appropriate for this data? Explain your answer.
Answer:
The measure of center that is appropriate for the given data is mode. As the mode is used to describe the categorical data as to which category occurs most often.
mode
b. Which measure or measures of variation are appropriate for this data? Explain your answer.
Answer:
There is no appropriate measure of variation that can be used for the given data. In a categorical data, we can only identify the relative frequency of the data using the given frequency for each category.
none
Texas Go Math Grade 6 Unit 6 Mixed Review Texas Test Prep Answer Key
Selected Response
Question 1.
Over 6 days, Jim jogged 6.5 miles, 5 miles, 3 miles, 2 miles, 3.5 miles, and 4 miles. What is the mean distance that Jim jogged each day?
(A) 3.75 miles
(B) 4 miles
(C) 4.5 miles
(D) 6.5 miles
Answer:
(B) 4 miles
Explanation:
Determine the mean of the data
mean = \(\frac{6.5+5+3+2+3.5+4}{6}\) get the sum of the values and divide it by 6
= \(\frac{24}{6}\) simplify
= 4 mean of the data
The mean of the data is B. 4 miles.
Question 2.
What is the range of the data represented by the stem-and-leaf plot shown below?
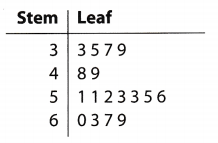
Key: \(\frac{3}{5}\) means 35
(A) 27
(B) 30
(C) 33
(D) 36
Answer:
(D) 36
Explanation:
Determine the range of the data.
range = 69 – 33 subtract the least value from the greatest value
= 36 range of the data
The range of the data is D. 36.
Question 3.
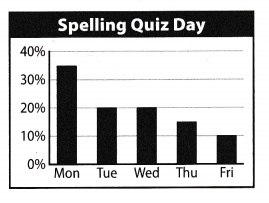
The percent bar graph below shows the day of the week on which students have their weekly spelling quiz. On which day do most students have their weekly spelling quiz?
(A) 20%
(B) 35%
(C) Tuesday
(D) Monday
Answer:
(D) Monday
Explanation:
The data with the greatest relative frequency based from the graph is Monday. It indicates that most students have spelling quiz on Mondays
D. Monday
Question 4.
The ages of the volunteers at a local food bank are shown below.
34, 25, 24, 50, 18, 46, 43, 36,32
What is the median of this set of data?
(A) 32
(B) 33.1
(C) 34
(D) 50
Answer:
(C) 34
Explanation:
Determine the median.
18, 24, 25, 32, 34, 36, 43, 46, 50
The median is the 5th value of the data which is 34.
Median is C. 34.
Question 5.
The dot plot shows the number of participants in each age group in a science fair.
Which of the following is not supported by the dot plot?
(A) The range is 6.
(B) The mean of the ages is about 14.4.
(C) The mode of the ages is 13.
(D) The median of the ages is 15.
Answer:
(C) The mode of the ages is 13.
Explanation:
Mode is not supported by the dot plot because there are no dots above the value of 13.
Question 6.
Which expression shows the prime factorization of 120?
(A) 23 × 3 × 5
(B) 2 × 3 × 5
(C) 1012
(D) 2 × 5 × 12
Answer:
(A) 23 × 3 × 5
Explanation:
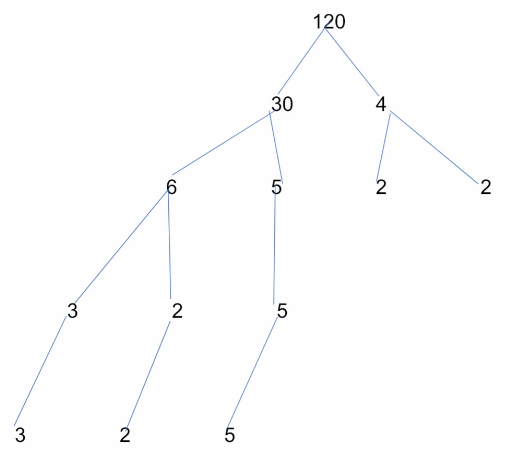
The prime factorization of the indicated number is A. 23 × 3 × 5.
Question 7.
The two longer sides of a triangle measure 22 units and 29 units. Which of the following is a possible length of the shortest side?
(A) 4
(B) 14
(C) 24
(D) 34
Answer:
(B) 14
Explanation:
a.
22 + 29 > 4 add the two sides and compare to the third side
51 > 4 the sum of the two sides is greater than the third side
22 + 4> 29 add the two sides and compare to the third side
26 ≯ 29 the sum of the two sides is NOT greater than the third side
29 + 4> 22 add the two sides and compare to the third side
33 > 22 the sum of the two sides is greater than the third side
b.
22 + 29> 14 add the two sides and compare to the third side
51 > 14 the sum of the two sides is greater than the third side
22 + 14 > 29 add the two sides and compare to the third side
36 > 29 the sum of the two sides is greater than the third side
29 + 14 > 22 add the two sides and compare to the third side
43 > 22 the sum of the two sides is greater than the third side
c.
22 + 29> 24 add the two sides and compare to the third side
51 > 24 the sum of the two sides is greater than the third side
22 + 24 > 29 add the two sides and compare to the third side
46 > 29 the sum of the two sides is NOT greater than the third side
29 + 24 > 22 add the two sides and compare to the third side
53 > 22 the sum of the two sides is greater than the third side
d.
22 + 29 > 34 add the two sides and compare to the third side
51 > 34 the sum of the two sides is greater than the third side
22 + 34 > 29 add the two sides and compare to the third side
56 > 29 the sum of the two sides is greater than the third side
29 + 34 > 22 add the two sides and compare to the third side
63 > 22 the sum of the two sides is greater than the third side
The possible shortest side of the triangle is B. 14.
Question 8.
On a map of the city, 1 centimeter represents 2.5 miles. What distance on the map would represent 20 miles?
(A) 6 centimeters
(B) 8 centimeters
(C) 12 centimeters
(D) 18 centimeters
Answer:
(B) 8 centimeters
Explanation:
2.5x = 20 determine the number of centimeters that will represent 20 miles
\(\frac{2.5 x}{2.5}\) = \(\frac{20}{2.5}\) divide both sides of the equation by 2.5
x = 8 centimeters simplify
8 centimeters
Question 9.
Which expression is equal to 0?
(A) \(\frac{-56}{7}\) – 8
(B) \(\frac{-56}{-7}\) + 8
(C) \(\frac{56}{7}\) + 8
(D) \(\frac{-56}{-7}\) – 8
Answer:
(D) \(\frac{-56}{-7}\) – 8
Explanation:
a.
= 8 – 8 divide the numerator by the denominator
= – 16 add and copy the same sign
b.
= 8 + 8 divide the numerator by the denominator
= 16 add
c.
= 8 + 8 divide the numerator by the denominator
= 16 add
d.
= 8 – 8 divide the numerator by the denominator
= 0 0
The expression which is equal to 0 is D
Gridded Response
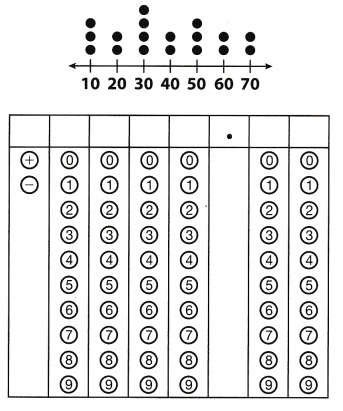
Question 10.
What is the median of the data represented by the dot plot?
Answer:
Median is the middle value of the data set The middle value of the indicated dot plot is on the 9th and 10th data. Therefore, we need to get the average of those values.
\(\frac{30+40}{2}\) = \(\frac{70}{2}\) = 35
The median of the data is 35.
Question 11.
The heights (in inches) of 8 students are 50, 53, 52, 68, 54, 49, 55, and 51. What is the mean height if the outlier is removed from the data?
Answer:
Determine the mean height without the outlier
mean = \(\frac{49+50+51+52+53+54+55}{7}\) get the sum of all the values then divide it by 7
= \(\frac{364}{7}\) simplify
= 52 mean of the data
The mean of the data is 52.
Hot Tip!
Read a graph or diagram as closely as you read the actual test question. These visual aids contain important information.
Question 12.
What is the interquartile range of the data represented by the box plot shown below?
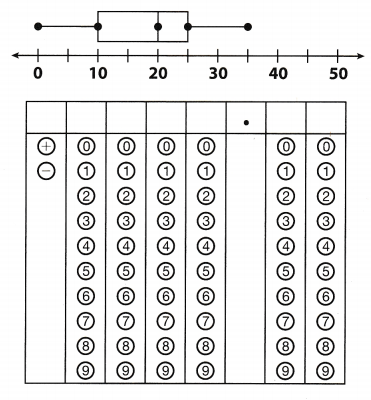
Answer:
IQR = 25 – 10 subtract the lower quartile from the upper quartile
= 15 interquartile range of the data
The interquartile range is 15
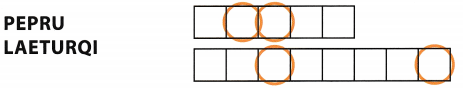
Vocabulary Preview
Use the puzzle to preview key vocabulary from this unit. Unscramble the circled letters to answer the riddle at the bottom of the page.
Question 1.
OBXLOTP 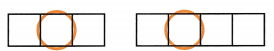
Answer:
Question 2.
TODTOLP ![]()
Answer:
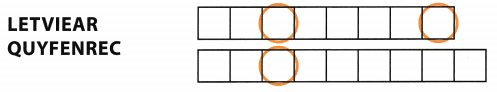
Question 3.
HOSTIARMG ![]()
Answer:
Question 4.
NIADEM ![]()
Answer:
Question 5.
Answer:
Question 6.
Answer:
1. A display that shows how the values in a data set are distributed. (Lesson 17-2)
2. A display in which each piece of data is represented by a dot above the number line. (Lesson 17-3)
3. A type of bar graph whose bars represent frequencies of numerical data within intervals. (Lesson 17-4)
4. The middle value of an ordered data set. (Lesson 17-1)
5. The median of the upper half of the data in a box plot. (Lesson 17-2)
6. The ratio of the frequency and the total amount of data. (Lesson 17-5)
Q: What is a math teacher’s favorite dessert?
A: ___ __ __ __ ___ __ __ ___
__ ___ ___ ___ __ ___ ___!