Refer to our Texas Go Math Grade 6 Answer Key Pdf to score good marks in the exams. Test yourself by practicing the problems from Texas Go Math Grade 6 Module 17 Quiz Answer Key.
Texas Go Math Grade 6 Module 17 Quiz Answer Key
Texas Go Math Grade 6 Module 17 Ready to Go On? Answer Key
17.1 Measures of Center
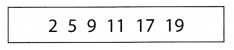
Question 1.
Find the mean and median of the data set. ____.
Answer:
Determine the mean and median.
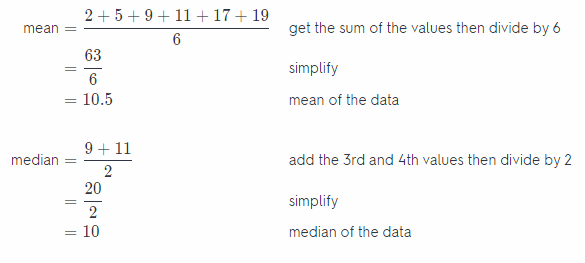
Mean = 10.5
Median = 10
17.2 Box Plots
Question 2.
Make a box plot for the data set.

Answer:
Box plot of the given data

Using the given data, identify the least value, first quartile, median, third quartile, and the greatest value to create a box plot of the data.
17.3 Dot Plots and Data Distribution
A baseball team scored the following number of runs over a 10-game period:
6, 6, 8, 5, 4, 6, 4, 3, 8, 4.
Question 3.
Make a dot plot for the data.
Answer:
Dot plot of the given data
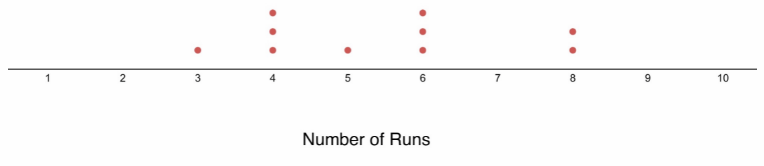
Use the frequency of the data to create a dot plot graph.
Question 4.
Find the mean, median, and range.
Answer:
Determine the mean, median, and range.
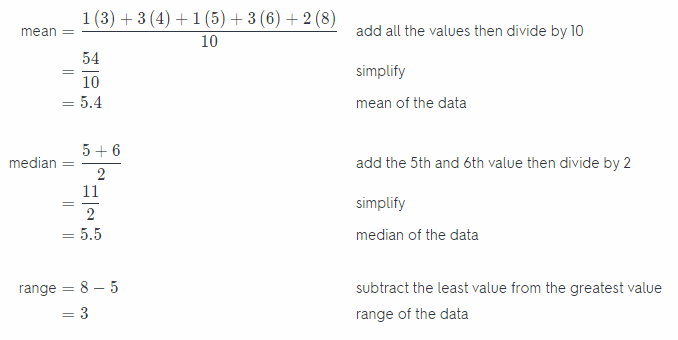
Mean = 5.4
Median = 5.5
Range = 3
17.4 Stem-and-Leaf Plots and Histograms
Question 5.
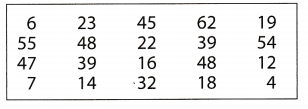
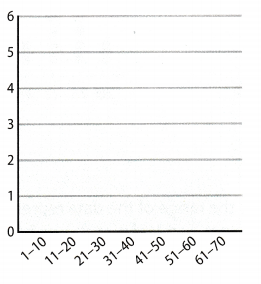
Make a histogram for the data set.
Answer:
Histogram of the given data

Using the frequency of the data and intervals to create the histogram.
17.5 Categorical Data
Question 6.
On one day, a pet store sells 2 birds, 6 gerbils, 4 puppies, 3 fish, and 3 hamsters. Identify the mode of the data and find its relative frequency expressed as a percent.
Answer:
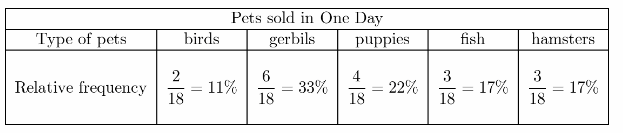
Graph of the data
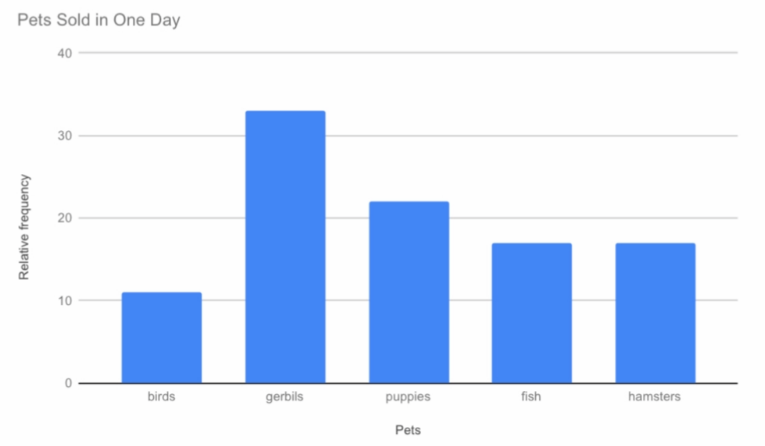
Based from the data set and graph, it shows that the mode of the given data indicates that the most sold out pet is the gerbil.
Texas Go Math Grade 6 Module 17 Mixed Review Texas Test Prep Answer Key
Selected Response
Question 1.
Over 6 days, Dan jogged 7.5 miles, 6 miles, 3 miles, 3 miles, 5.5 miles, and 5 miles. What is the mean distance that Dan jogged each day?
(A) 3 miles
(B) 5 miles
(C) 5.25 miles
(D) 7.5 miles
Answer:
(B) 5 miles
Explanation:
Determine the mean of the data
mean = \(\frac{7.5+6+3+3+5.5+5}{6}\) add all the values then divide by 6
= \(\frac{30}{6}\) simplify
= 5 miles mean of the dat
The mean of the data is B. 5 miles.
Question 2.
What is the interquartile range of the data represented by the box plot shown below?
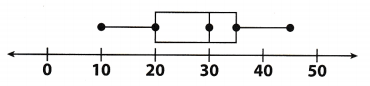
(A) 15
(B) 20
(C) 35
(D) 40
Answer:
(A) 15
Explanation:
The interquartile range is the difference between the first quartile and the third quartile.
IQR = 35 – 20 subtract the first quartile from the third quartile
= 15 value of the interquartile range
The interquartile range of the data is A. 15.
Question 3.
What is the median of the data represented by the dot plot ?
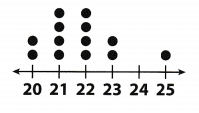
(A) 21
(B) 21.5
(C) 22
(D) 25
Answer:
(C) 22
Explanation:
First count the number of dots above the line, then get the middle value of the data. The middle dot is located at the 7th dot with a value of 22. Therefore, the median of the data is 22.
The median of the data is C. 22.
Question 4.
What is the range of the data represented by the stem-and-leaf plot shown below?
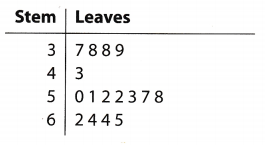
Key: 3|7 means 37
(A) 25
(B) 26
(C) 28
(D) 65
Answer:
(C) 28
Explanation:
Range is the difference between the least and greatest data value.
range = 65 – 37 subtract the least value from the greatest value
= 28 range of the data
The range of the data is C. 28.
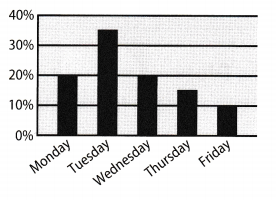
The percent bar graph below shows what day of the week students have music class.
Question 5.
What is the mode of the data?
(A) 20%
(B) 35%
(C) Tuesday
(D) Wednesday
Answer:
(C) Tuesday
Explanation:
Mode indicates how frequent a value occurs or how often a value was chosen. In the given graph, the bar with the tallest height is Tuesday. It was the most frequent day of the week for students to have music class.
The mode of the data is C. Tuesday.
Question 6.
The graph displays data collected from 200 students. How many more students have music class on Tuesday than on Friday?
(A) 1o
(B) 20
(C) 50
(D) 70
Answer:
Determine the number of students for each day.
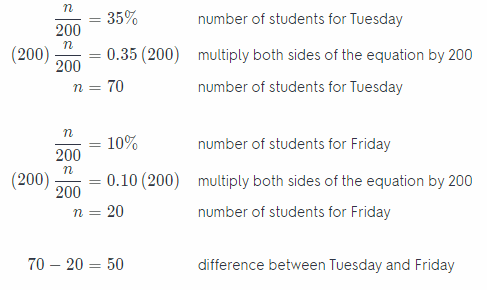
There are C. 50 more students on Tuesday than on Friday.
Gridded Response
Question 7.
What is the solution of the equation 5x = 195.5?
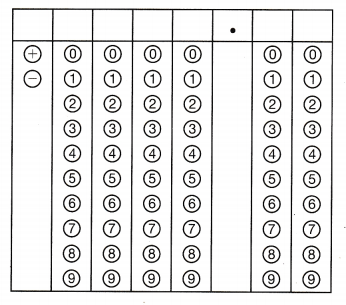
Answer:
Determine the value of x.
\(\frac{5 x}{5}\) = \(\frac{195.5}{5}\) divide both sides of the equation by 5
x = 39.1 value of x
The solution to the equation is 39.1.