Refer to our Texas Go Math Grade 6 Answer Key Pdf to score good marks in the exams. Test yourself by practicing the problems from Texas Go Math Grade 6 Lesson 8.2 Answer Key Ratios, Rates, Tables, and Graphs.
Texas Go Math Grade 6 Lesson 8.2 Answer Key Ratios, Rates, Tables, and Graphs
Reflect
Question 1.
Look for a Pattern When the amount of solvent increases by 1 milliliter, the amount of distilled water increases by ____________ milliliters. So 6 milliliters of solvent requires ____________ milliliters of distilled water.
Answer:
1 ∙ 50 = 50
6 ∙ 50 = 300
50 milliliters, 300 milliliters.
Question 2.
Communicate Mathematical Ideas How can you use the graph to find the amount of distilled water to use for 4.5 milliliters of solvent?
Answer:
Locate the point x = 4.5 on the graph and then study its corresponding value of y. This value of y is the amount of distilled water required for 4.5 ml of ammonia and will be equal to 4.5 × 50 = 225 ml.
Your Turn
Question 3.
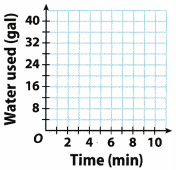
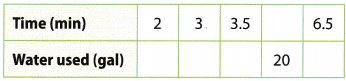
A shower uses 12 gallons of water in 3 minutes. Complete the table and graph.
Answer:
To find the unit rate, divide the numerator and denominator by 3:
![]()
The shower uses 4 gallons per minute.
Use this rate to complete the table.
If you need to find the amount of used water, multiply the time by 4.
If you need to find the time, divide the amount of used water by 4.
| time | gallon |
| 2 | 8 |
| 3 | 12 |
| 3.5 | 14 |
| 5 | 20 |
| 6.5 | 26 |
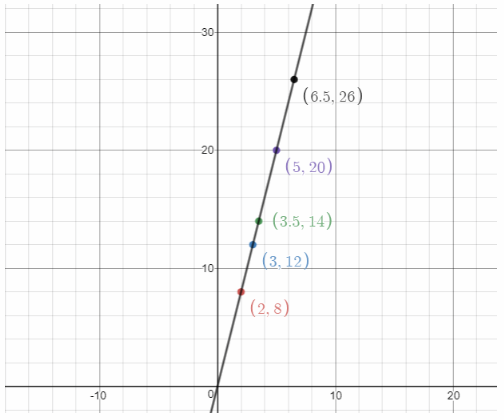
List the ordered pairs from the table:
(2,8), (3. 12), (3.5. 14), (5, 20), (6.5, 26)
and graph them on a coordinate plane.
The shower uses 4 gallons per minute.
Texas Go Math Grade 6 Lesson 8.2 Guided Practice Answer Key
Question 1.
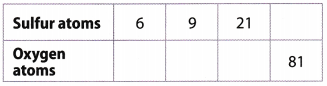
Sulfur trioxide molecules all have the same ratio of oxygen atoms to sulfur atoms. A number of molecules of sulfur dioxide have 18 oxygen atoms and 6 sulfur atoms. Complete the table.
What are the equivalent ratios shown in the table?
Answer:
To find the unit rate, divide the numerator and denominator by 6:
![]()
To find the number of sulfur atoms, multiply the number of oxygen atoms by 3.
To find the number of oxygen atoms, divide the number of sulfur atoms by 3.
| Sulfur | Oxygen |
| 6 | 18 |
| 9 | 27 |
| 21 | 63 |
| 27 | 81 |
Equivalent ratios are:
\(\frac{6}{18}=\frac{9}{27}=\frac{21}{63}=\frac{27}{81}\)
Question 2.
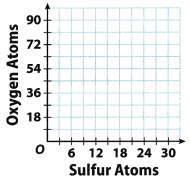
Graph the relationship between sulfur atoms and oxygen atoms.
Answer:
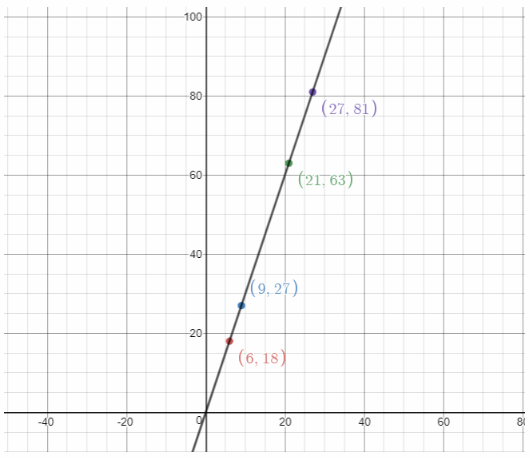
List the ordered pairs from the table:
(6, 18), (9, 27), (21, 63), (27, 81)
and graph them on a coordinate plane.
Question 3.
Stickers are made with the same ratio of width to length. A sticker 2 inches wide has a length of 4 inches. Complete the table.
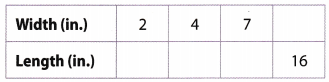
What are the equivalent ratios shown in the table?
Answer:
| Width (in) | Length (in) |
| 2 | 4 |
| 4 | 8 |
| 7 | 14 |
| 8 | 16 |
| For every 2 inches of width the length is 4 inches. | This implies that there is \( \frac{4}{2} \) = 2 inches of length per inch of width. |
Equivalent ratio of width to length is 1 : 2
Question 4.
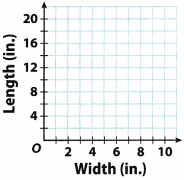
Graph the relationship between the width and the length of the stickers.
Answer:
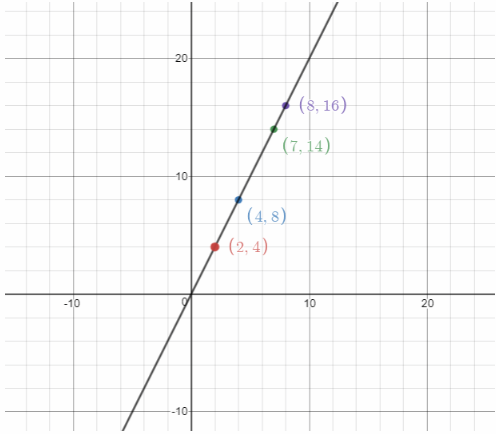
List the ordered pairs from the table:
(2, 4), (4, 8), (7, 14), (8, 16)
and graph them on a coordinate plane.
Question 5.
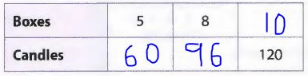
Five boxes of candles contain a total of 60 candles. Each box holds the same number of candles. Complete the table and graph the relationship.
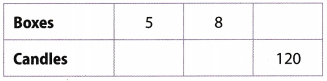
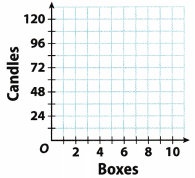
Answer:
There are 60 candles in 5 boxes so each box can hold up to \(\frac{60}{5}\) = 12 candles so the rate is 12 candles per box.
Use this function to complete the table.
Table:
Graph of y = 12x:
Essential Question Check-In
Question 6.
How do you represent real-world problems involving ratios and rates with tables and graphs?
Answer:
Real-world problems involving ratios and rates are represented with tables as ordered pairs and then these ordered pairs are graphed to study the relation between the 2 given variables or quantities.
We can study the relation between the two given variables or quantities.
The table shows information about the number of sweatshirts sold and the money collected at a fund raiser for school athletic programs. For Exercises 7 – 12, use the table.
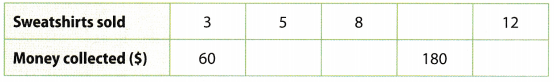
Question 7.
Find the rate of money collected per sweatshirt sold. Show your work.
Answer:
According to the given data, the sale of 3 sweatshirts collected $60, so this means that 1 sweatshirt collected \(\frac{\$ 60}{3}\) = $20
$20 is collected per sweatshirt sold.
Question 8.
Use the unit rate to complete the table.
Answer:
$20 is collected per sweatshirt sold, so the sale of 5 sweatshirts will generate 5 × $20 = $100.
$20 is collected per sweatshirt sold, so the sale of 8 sweatshirts will generate 8 × $20 = $160.
$20 is collected per sweatshirt sold, so the sale of 12 sweatshirts will generate 12 × $20 = $240.
$20 is collected per sweatshirt sold, so $180 was collected by selling \(\frac{\$ 180}{\$ 20}\) = 9 sweatshirts.
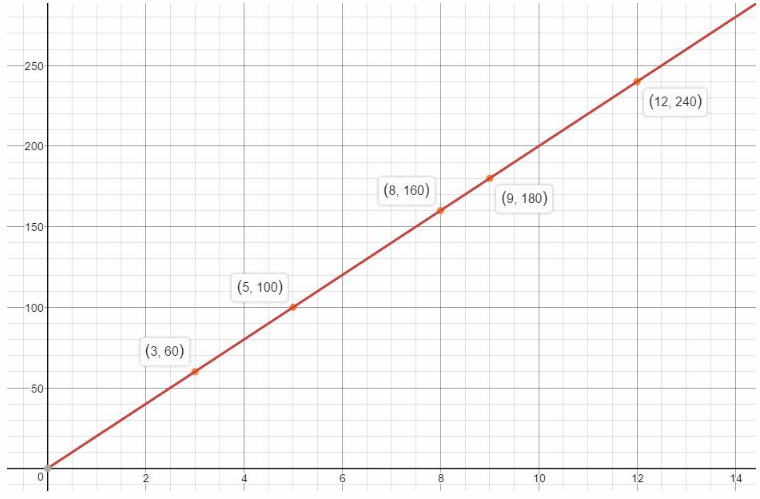
Question 9.
Explain how to graph Information from the table.
Answer:
List the ordered pairs from the table:
(3, 60), (5, 100), (8, 160), (9, 180), (12. 240)
and graph them on a coordinate plane.
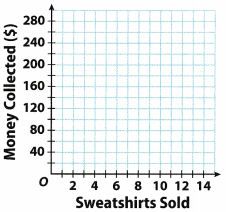
Question 10.
Write the information in the table as ordered pairs. Graph the relationship from the table.
Answer:
The information in the tabLe can be written as ordered pairs (x, y) so this becomes:
(3, 60), (5, 100), (8, 160), (9, 180) and (12, 240). Plot these on a graph and join them using a straight line to graph the function:
Question 11.
What If? How much money would be collected if 24 sweatshirts were sold? Show your work.
Answer:
Each sweatshirt sold, collects $20 so the sale of 24 will collect 24 × $20 = $480.
The sale of 24 sweatshirts will collect $480.
Question 12.
Analyze Relationships Does the point (5.5, 110) make sense in this context? Explain.
Answer:
The point (5.5, 110) does not make sense in this context because the independent variable x, the number of shirts sold is discrete and not continuous. This means that selling 5.5 sweatshirts does not make sense, the number of sweatshirts sold MUST be a whole number.
Question 13.
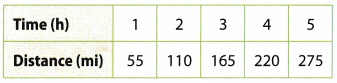
Communicate Mathematical Ideas The table shows the distance Randy drove on one day of her vacation. Find the distance Randy would have gone if she had driven for one more hour at the same rate. Explain how you solved the problem.
Answer:
From the data given in the table, it can be seen that she covers a distance of 55 miles in 1 hour, so in 6 hours she would have covered a distance of 6 × 55 = 330 miles.
She would have covered a distance of 330 miles.
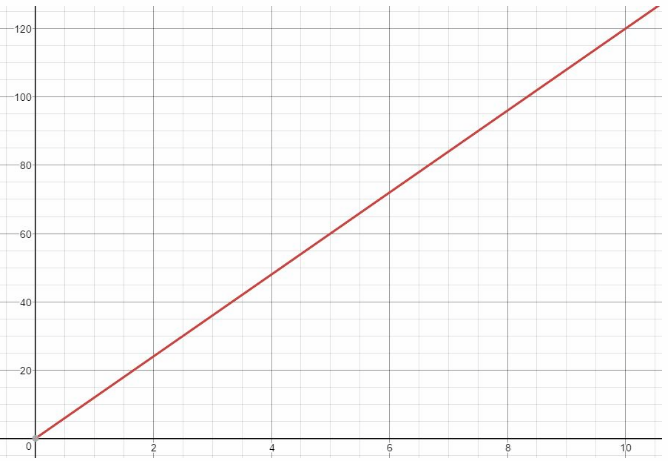
Use the graph for Exercises 14 – 15.
Question 14.
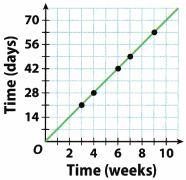
Analyze Relationships Does the relationship show a ratio or a rate? Explain.
Answer:
The ratio because it represents the relationship between the two numbers.
Question 15.
Represent Real-World Problems What is a real-life relationship that might be described by the graph?
Answer:
We can find out how many days are in for example, one, two or three weeks.
Ordered pair on the graph (4, 28) tells us there are
28 days in 4 weeks.
H.O.T. Focus On Higher Order Thinking
Question 16.
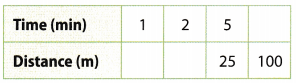
Make a Conjecture Complete the table.
Then find the rates \(=\frac{\text { distance }}{\text { time }}\) and \(\frac{\text { time }}{\text { distance }}\)
\(\frac{\text { distance }}{\text { time }}\) = _______________
\(\frac{\text { time }}{\text { distance }}\) = _______________
Answer:
| Time | Distance |
| 1 | 5 |
| 2 | 10 |
| 5 | 25 |
| 20 | 100 |
\(\frac{\text { distance }}{\text { time }}\) = \(\frac{5}{1}\)
\(\frac{\text { time }}{\text { distance }}\) = \(\frac{1}{5}\)
a. Are the \(\frac{\text { time }}{\text { distance }}\) rates equivalent? Explain.
Answer:
They are equivalent because
\(\frac{1}{5} \cdot \frac{2}{2}=\frac{2}{10}\)
\(\frac{1}{5} \cdot \frac{5}{5}=\frac{5}{25}\)
\(\frac{1}{5} \cdot \frac{20}{20}=\frac{20}{100}\)
b. Suppose you graph the points (time, distance) and your friend graphs (distance, time). How will your graphs be different?
Answer:
The graph of (time, distance) will grow slower than graph of (distance, time)
Question 17.
Communicate Mathematical Ideas To graph a rate or ratio from a table, how do you determine the scales to use on each axis?
Answer:
The maximum values of the 2 given quantities is considered and based on that, the scales of the axes of the graphs are decided.