Refer to our Texas Go Math Grade 6 Answer Key Pdf to score good marks in the exams. Test yourself by practicing the problems from Texas Go Math Grade 6 Lesson 17.4 Answer Key Stem-and-Leaf Plots and Histograms.
Texas Go Math Grade 6 Lesson 17.4 Answer Key Stem-and-Leaf Plots and Histograms
Essential Question
How can you display data in a stem-and-leaf plot and in a histogram?
Texas Go Math Grade 6 Lesson 17.4 Explore Activity Answer Key
Explore Activity
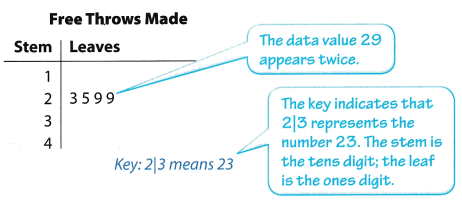
Making a Stem-and-Leaf Plot
You can use a stem-and-leaf plot to display numeric data. Each data value consists of a stem and a leaf.
The 12 members of the high-school basketball team have a free-throw drill. Each player attempts 50 free throws. The number of free throws made by each player is given.
44, 35, 29, 25, 33, 36, 35, 23, 30, 29, 19, 32
A. Group the data by tens digits. Then order the data from least to greatest.
19 23 25 29 29 30 32
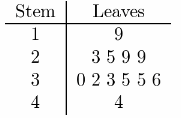
B. Organize the data in a stem-and-leaf plot.
Use the tens digits as stems. Use the ones digits as leaves. Write the leaves in increasing order.
Reflect
Question 1.
Where are most of the data values? How can you tell from looking at the stem-and-leaf plot?
Answer:
Based from the completed stern and leaf plot, most of the data values can be seen on the third stem of the plot.
The most data values is shown on the third stem of the plot
Your Turn
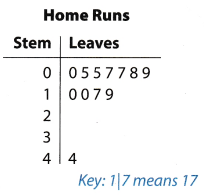
The number of home runs a baseball player hit in each season he played is shown in the stem-and-leaf plot.
Question 2.
How many seasons are included in the stem-and-leaf plot? What is the least number of home runs the baseball player had in one season?
Answer:
There are 12 seasons shown in the stem-and-leaf plot based on the number of leaves indicated. The least number of home runs in one season is 0.
12 seasons and 0 home run as the least number.
Question 3.
Find the median and the mean. Which measure of center better represents the data? Justify your answer.
Answer:
Determine the median and the mean of the given data.
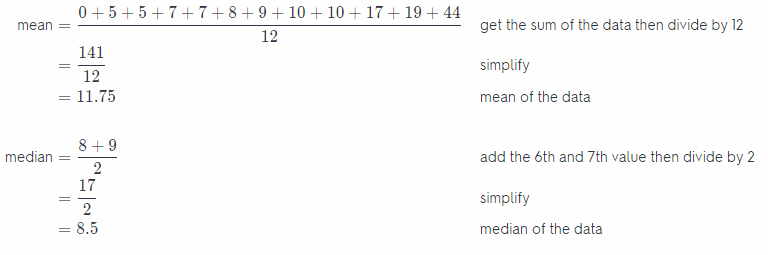
The median represents the data better even if the outlier will be removed.
The mean is 11.75 while the value of the median is 8.5 which represents the data better
Your Turn
Question 4.
Kim has started rating each movie she sees using a scale of 1 to 10 on an online site. Here are her ratings so far:
6, 9, 8, 5, 7, 4, 8, 8, 3, 7, 8, 7, 5, 1, 10
Make a histogram of the data. What does the shape of the distribution tell you about Kim’s rating?
Answer:
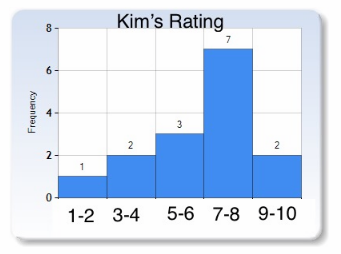
The highest bar is for the interval 7- 8 which means that Kim gave this rating more than any other intervals.
She rated more at an interval of 7-8.
Texas Go Math Grade 6 Lesson 17.4 Guided Practice Answer Key
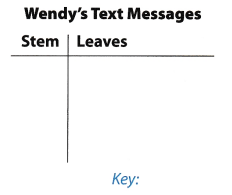
Wendy kept track of the number of text messages she sent each day for two weeks. Use her data for 1 and 2. Wendy’s Text Messages
35, 20, 46, 29, 27, 33, 15, 52, 27, 30, 35, 24, 34, 42.
Question 1.
Complete the stem-and-leaf plot. (Explore Activity)
Answer:
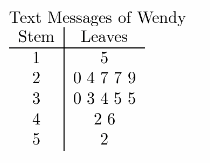
Stem-and-leaf plot of the text messages of Wendy for two weeks.
Question 2.
Find the mean and median of Wendy’s data. Which measure of center, if any, better represents the number of text messages she sent on a typical day? Justify your answer.
Answer:
Determine the median and the mean of the given data.
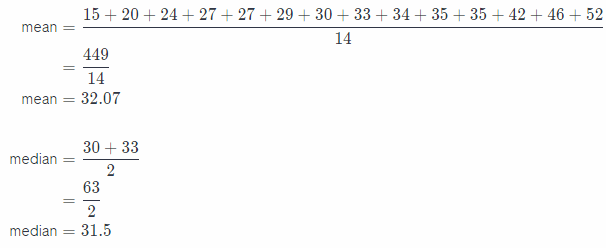
The value of the mean is 32.07 whiLe the median is 31.5 which better represents the number of text messages sent.
Question 3.
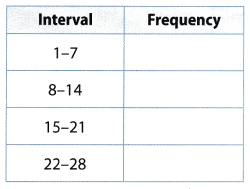
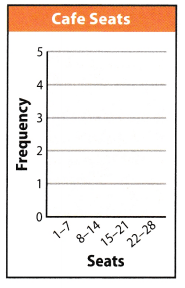
Ed counted the number of seats available in each café in his town. Complete the frequency table and the histogram. (Example 2)
Answer:
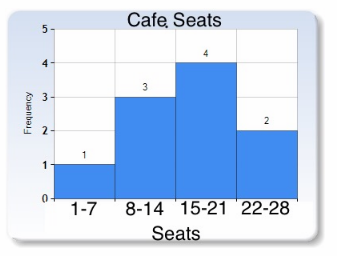
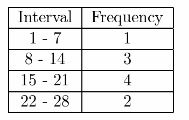
Frequency table and histogram of the number of cafe seats in his town.
Essential Question Check-In
Question 4.
How can you display data in a stem-and-leaf plot and in a histogram?
Answer:
Numerical data can be displayed in the stem-and-leaf plot by rows for all intervals. It separates the value by its place value where the tens digit is the stem and the ones digit is the leaf.
In histogram, the data is displayed using a bar graph which represents the frequency of the numerical data within the given intervals.
In stem-and-Leaf plot, the data values are displayed separating the ones and tens digit while in histogram, bar graph is used to show frequency of the data.
Texas Go Math Grade 6 Lesson 17.4 Independent Practice Key
An amusement park employee records the ages of the people who ride the new roller coaster during a fifteen-minute period.
Ages of riders: 47, 16, 16, 35, 45, 43, 11, 29, 31, 50, 23, 18, 18, 20, 29, 17, 18, 48, 56, 24, 18, 21, 38, 12, 23.
Question 5.
Complete the frequency table. Then make a histogram of the data.
Answer:
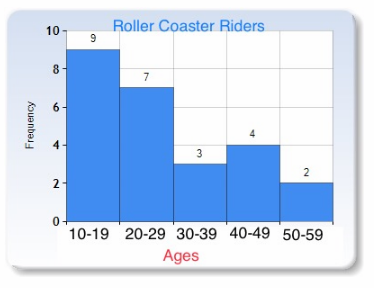
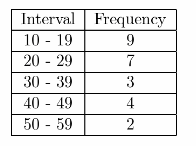
Frequency table and histogram of the ages of the roller coaster riders.
Question 6.
Describe two things you know about the riders who are represented by the data.
Answer:
The information that can be represented by the data is about the ages of the people riding the roller coaster and the number of people under each age bracket.
Age of riders and number of people under each age interval.
Question 7.
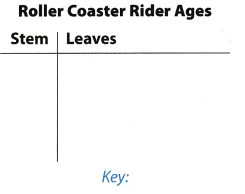
Use the same data to make a stem-and-leaf plot.
Answer:
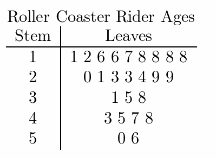
Stem-and-leaf plot of the roller coaster riders ages.
Question 8.
Find the mean, median, and range of the data.
Answer:
Determine the median and the mean of the given data.
mean = \(\frac{706}{25}\) get the sum of the values then divide by 25
mean = 28.24 mean of the data
median = 23 13th value of the data
range = 56 – 11 subtract the least vaLue from the greatest value
= 45 range of the data
Mean = 28.24
Median = 23
Ranae = 45
Question 9.
How are the two displays similar? How are they different?
Answer:
Both displays show the frequency and median of the data while the mean and range cannot be easily seen The stem-and-leaf plot shows the numerical data while the histogram shows a graph of the frequency of the numerical values.
They are similar in identifying the frequency and median of the data while they differ in terms of how the data has been presented.
Texas Go Math Grade 6 Lesson 17.4 H.O.T. Focus On Higher Order Thinking Answer Key
Question 10.
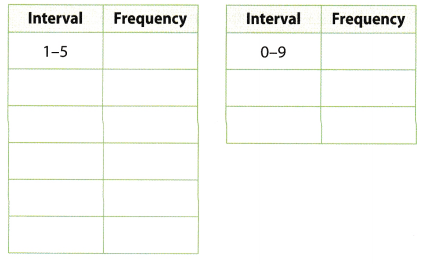
West Middle School has classes of many different sizes during first period. The number of students in each class is shown.
9, 23, 18, 14, 20, 26, 14, 18, 18, 12, 8, 13, 21, 22, 28, 10, 7, 19, 24, 20
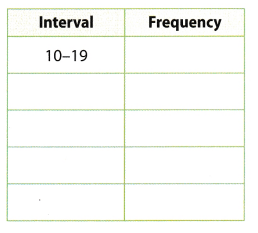
a. Complete each frequency table.
Answer:
Frequency table
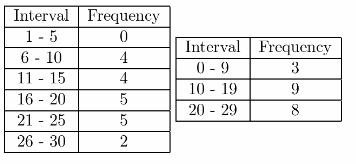
Frequency table with different classes of intervals
b. Suppose you were to make a stem-and-leaf plot and a histogram of the data. Which frequency table would you use if you wanted the two displays to use the same intervals?
Answer:
It is better to use the second frequency table having 3 classes with 0-9 interval because it shows the proper interval of rows for the stem-and-leaf plot together with the representation of graph for the histogram
The frequency table with three classes of intervals 0-9, 10-19, and 20-29
Question 11.
Critical Thinking The bars on a histogram all have the same height. What is true about the frequencies for the intervals? Give an example of a set of data that could be represented by such a histogram.
Answer:
If the bars of the histogram have the same height, it indicates that the data values have the same frequency. One example is the height of students in one school. The intervals will show the height of the students and the bar will indicate the number of students that belong to that interval.
The frequency of the intervals are equal if the height of the bars are equal.
Question 12.
Multiple Representations Suppose someone shows you a stem-and-leaf plot with data values ranging from 0 to 100.
a. What other types of displays that you learned about in this module could you use to show the data?
Answer:
Stem-and-leaf plot indicates the frequency of the data values for each row. It also displays the measure of center and spread of data values.
a. Frequency of data values per row.
b. What measures of center and spread could you find from the stem- and-leaf plot?
Answer:
The measures of center and spread that is indicated in the stem-and-leaf plot is the median which is based on the number of data values and the range which indicates the difference of the smallest and greatest value in the data. It can also help in analyzing and describing the shape of the distribution.
It shows the median and the range of data.