Refer to our Texas Go Math Grade 6 Answer Key Pdf to score good marks in the exams. Test yourself by practicing the problems from Texas Go Math Grade 6 Lesson 14.2 Answer Key Independent and Dependent Variables in Tables and Graphs.
Texas Go Math Grade 6 Lesson 14.2 Answer Key Independent and Dependent Variables in Tables and Graphs
Essential Question
How can you identify independent and dependent quantities from tables and graphs?
Texas Go Math Grade 6 Lesson 14.2 Explore Activity Answer Key
Explore Activity 1
Identifying independent and Dependent Quantities from a Table
Many real-world situations involve two variable quantities in which one quantity depends on the other. The quantity that depends on the other quantity is called the dependent variable, and the quantity it depends on is called the independent variable.
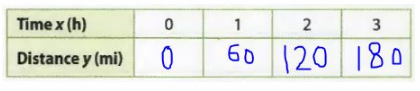
A freight train moves at a constant speed. The distance y in miles that the train has traveled afterx hours is shown in the table.
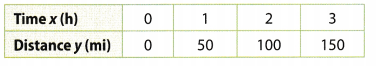
A. What are the two quantities in this situation?
Which of these quantities depends on the other?
What is the independent variable? _____________________
What is the dependent variable? ______________________
B. How far does the train travel each hour? ________________
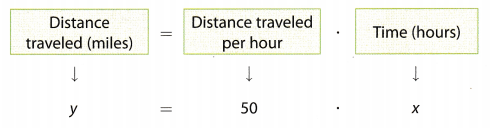
The relationship between the distance traveled by the train and the time in hours can be represented by an equation in two variables.
Reflect
Question 1.
Analyze Relationships Describe how the value of the independent variable is related to the value of the dependent variable. Is the relationship additive or multiplicative?
Answer:
It can be seen that when the independent variable is 0 the dependent variable is 0 and then the dependent variable is proportional to the independent variable by ×50. Therefore, it can be said that the y = 50x. The relation is multiplicative.
Question 2.
What are the units of the independent variable and of the dependent variable?
Answer:
The independent variable here is time in hours while the dependent variable distance traveled in miles. The constant of proportionality is the speed of the train in miles per hour.
Question 3.
A rate is used in the equation. What is the rate?
Answer:
The constant of proportionality or the rate of change of y with respect to x, is the speed of the train in miles per hour. It is 50 miles per hour.
Explore Activity 2
Identifying independent and Dependent Variables from a Graph
In Explore Activity 1, you used a table to represent a relationship between an independent variable (time) and a dependent variable (distance).You can also use a graph to show a relationship of this sort.
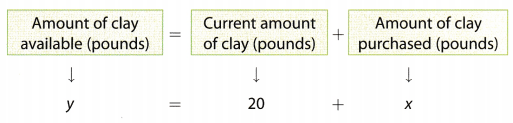
An art teacher has 20 pounds of clay but wants to buy more clay for her class. The amount of clay x purchased by the teacher and the amount of clay y available for the class are shown on the graph.
A. If the teacher buys 10 more pounds of clay, how many pounds will be available for the art class? _____________lb
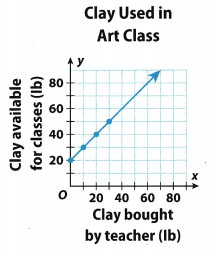
If the art class has a total of 50 pounds of clay available, how many pounds of clay did the teacher buy?
How can you use the graph to find this information?
B. What are the two quantities in this situation?
Which of these quantities depends on the other?
What is the independent variable? ____________
What is the dependent variable? ______________
C. The relationship between the amount of clay purchased by the teacher and the amount of clay available to the class can be represented by an equation in two variables.
D. Describe in words how the value of the independent variable is related to the value of the dependent variable.
Reflect
Question 4.
In this situation, the same units are used for the independent and dependent variables. How is this different from the situation involving the train in the first Explore?
Answer:
In this situation, the same units are used for the independent and dependent variables. This is different from the situation involving the train in the first Explore as in that the units of the independent and dependent variables were different from each other.
Question 5.
Analyze Relationships Tell whether the relationship between the independent variable and the dependent variable is a multiplicative or an additive relationship.
Answer:
The relationship between the independent variable and the dependent variable is additive relationship because the coefficient of x or the independent variable is 1 and 20 is being added to ¡t
Question 6.
What are the units of the independent variable, and what are the units of the dependent variable?
independent variable: ___ ; dependent variable: ____
Answer:
The unit of the independent variable and the unit of the dependent variabLe here is pounds.
Pounds.
Example 1.
A. The table shows a relationship between two variables, x and y. Describe a possible situation the table could represent. Describe the independent and dependent variables in the situation.
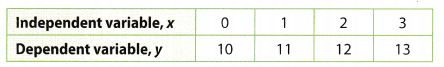
As x increases by 1, y increases by 1. The relationship is additive. The value of y is always 10 units greater than the value of x.
The table could represent Jina’s savings if she starts with $10 and adds $1 to her savings every day.
The independent variable, x, is the number of days she has been adding money to her savings.
The dependent variable, y, is her savings after x days.
B. The graph shows a relationship between two variables.
Describe a possible situation that the graph could represent. Describe the independent and dependent variables. 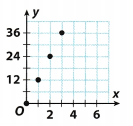
As x increases 1y 1, y increases L’y 1 2. The relationship is multiplicative. The value of y is always 12 times the value of x.
The graph could represent the number of eggs in cartons that each hold 12 eggs.
The independent variable, x, is the number of cartons.
The dependent variable, y, is the total number of eggs.
Reflect
Question 7.
What are other possible situations that the table and graph in Example 1 could represent?
Answer:
A real world example of the table can be a $10 membership of a books club, where the registration costs $10 and then it is $1 per hook. Here the number of books burrowed is the independent variable; x and the cost to be paid is the dependent variable; y,
Your Turn
Describe a real-world situation that the variables could represent. Describe the relationship between the independent and dependent variables.
Question 8.
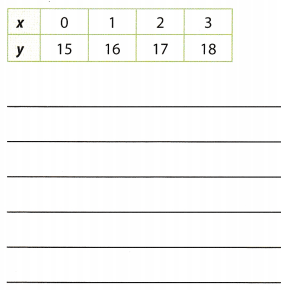
Answer:
The table represents an additive relation between tue independent and the dependent variable, given by the equation y = x + 15. A real world example to model the relationship can be the amount of money earned per week by Sam if bis weekly pocket is $15 and he gets $1 for every errand that he runs for his parents.
Question 9.
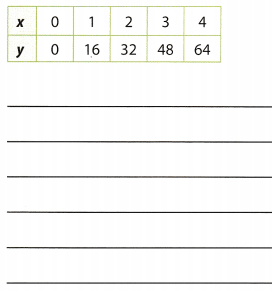
Answer:
The table represents a multiplicative relation between the independent and the dependent variable, given by the equation y = 16x. A real world example to model the relationship can be the cost of attending a movie and lunch per person. Here the independent variable is the number of people and the dependent variable is the cost
Question 10.
Answer:
The graph represents a multiplicative relation between the independent and the dependent variable because the graph passes through the origin and is given by the equation y = 3x. A real world example to model the relationship can be the cost of sandwiches. Here the independent variable is the number of sandwiches bought and the dependent variable is the cost.
Texas Go Math Grade 6 Lesson 14.2 Guided Practice Answer Key
Identify the coordinates of each point in the coordinate plane. Name the quadrant where each point is located. (Example 1)
Question 1.
A boat rental shop rents paddleboats for a fee plus an additional cost per hour. The cost of renting for different numbers of hours is shown in the table.
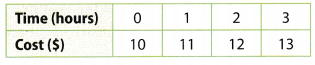
What is the independent variable, and what is the dependent variable?
How do you know? (Explore Activity )
Answer:
The independent variable is the time in hours for which the boat is rented for.
The dependent variable is the amount of rent in dollars; y for renting a boat for x hours.
Question 2.
A car travels at a constant rate of 60 miles per hour. (Explore ActIvity 1)
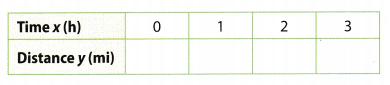
a. Complete the table.
Answer:
Table: Each value of x is multiplied with 60 to evaluate the value of y:
b. What is the independent variable, and what is the dependent variable?
Answer:
The independent variable is time in hours and the dependent variable is distance traveled in mites.
c. Describe how the value of the dependent variable is related to the value of the independent variable.
Answer:
The independent variable x and the dependent variable y are related by the equation y = 60x
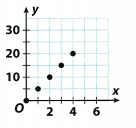
Use the graph to answer the questions.
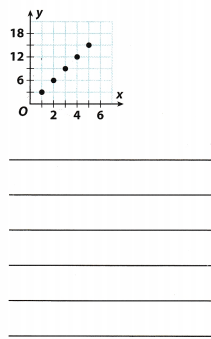
Question 3.
Describe in words how the value of the dependent variable is related to the value of the independent variable. (Explore Activity 2)
Answer:
It can be seen that each value of y is 5 times that of x so it can be said that they are related by the equation: y = 5x
Question 4.
Describe a real-world situation that the graph could represent. (Example 1)
Answer:
The graph represents a multiplicative relation between the independent and the dependent variable because the graph passes through the origin and is given by the equation y = 5x. A real world example to model the relationship can be the cost of sandwich meals. Here the independent variable is the number of sandwich meals bought and the dependent variable is the cost.
Essential Question Check-In
Question 5.
How can you identify the dependent and independent variables in a real-world situation modeled by a graph?
Answer:
According to a graphing convention, the independent variabLe is aLways plotted on the x-axis while the dependent variable is always plotted on the y-axis, so from the graph the quantity on the x-axis is the independent variable and that on the y-axis is the dependent variable.
Texas Go Math Grade 6 Lesson 14.2 Independent Practice Answer Key
Question 6.
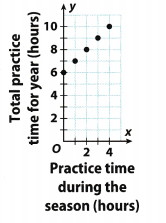
The graph shows the relationship between the hours a soccer team practiced after the season started and their total practice time for the year.
a. How many hours did the soccer team practice before the season began?
Answer:
From the graph we can see that soccer team practiced 6 hours before the season began.
b. What are the two quantities in this situation?
Answer:
In this situation there are two quantities: first one is practice time during the season in hours and the second one is total practice time for year, also in hours.
c. What are the dependent and independent variables?
Answer:
Here the dependent variable is total practice time for year and independent variable is practice time during the season.
d. Analyze Relationships Describe the relationship between the quantities in words.
Answer:
We can notice that as x increase by 1, y increases by 1
e. Is the relationship between the variables additive or multiplicative? Explain.
Answer:
We can conclude that this relationship is additive because the value of dependent variable is always 6 units greater than the value of independent variable.
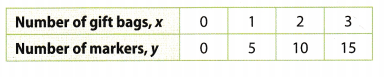
Question 7.
Multistep Teresa is buying glitter markers to put in gift bags. The table shows the relationship between the number of gift. Number of marker bags and the number of glitter markers she needs to buy.
a. What is the dependent variable? ______________________
Answer:
Here, the dependent variable is number of markers, y.
b. What is the independent variable? _____________________
Answer:
Here, the independent variable is number of gift bags, x.
c. Describe the relationship between the quantities in words.
Answer:
As x increases by 1, y increases by 5.
d. Is the relationship additive or multiplicative? Explain.
Answer:
We can notice that the relationship is multiplicative because the value of y is always 5 times the value of x.
Question 8.
Ty borrowed $500 from his parents. The graph shows how much he owes them each month if he pays back a certain amount each month.
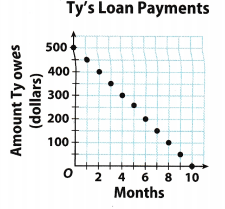
a. Describe the relationship between the number of months and the amount Ty owes. Identify an independent and dependent variable and explain 200 your thinking.
Answer:
The independent variable here is time in months and the dependent variable is amount of money left to be returned in dollars. As the time in months increases, this amount of debt decreases as he will paying back at a rate of $50 per month.
b. How long will it take Ty to pay back his parents?
Answer:
Locate the value of x when y = 0. Here that point is (10, 0) and implies that after tile luth payment, he will owe $o to his parents.
Texas Go Math Grade 6 Lesson 14.2 H.O.T. Focus On Higher Order Thinking Answer Key
Question 9.
Error Analysis A discount store has a special: 8 cans of juice for a dollar. A shopper decides that since the number of cans purchased is 8 times the number of dollars spent, the cost is the independent variable and the number of cans is the dependent variable. Do you agree? Explain.
Answer:
No, the cost is the dependent variable and the number of cans is the independent variable because the cost or money obtained depends on the sale of cans.
Question 10.
Analyze Relationships Provide an example of a real-world relationship where there is no clear independent or dependent variable. Explain.
Answer:
A real-world relationship when there is no clear independent or dependent value could be when there is no value in the independent and dependent variable at all, or when the independent and dependent variable have the same value. Therefore, the variables will be indiscernible since their values will be exactly alike.