Refer to our Texas Go Math Grade 5 Answer Key Pdf to score good marks in the exams. Test yourself by practicing the problems from Texas Go Math Grade 5 Unit 5 Answer Key Data Analysis.
Texas Go Math Grade 5 Unit 5 Answer Key Data Analysis
Show What You Know
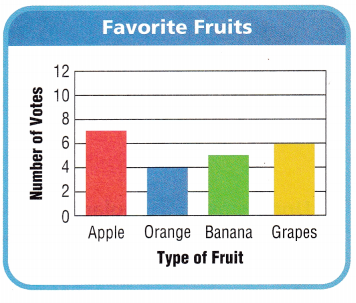
Read Bar Graphs Use the graph to answer the questions.
Question 1.
Which fruit received the most votes?
Answer: Apple
Question 2.
Which fruit received 5 votes? ____
Answer: Banana
Question 3.
There were ___ votes in all.
Answer: 22
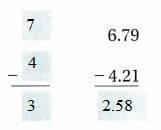
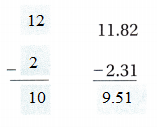
Subtract Decimals Estimate.
Then find the difference.
Question 4.
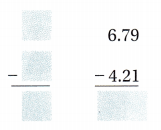
Answer:
Question 3.
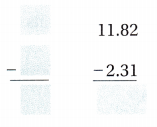
Answer:
Place Value Within 1,000,000 Show 582,649 in the place-value chart. Write the value of the digits.
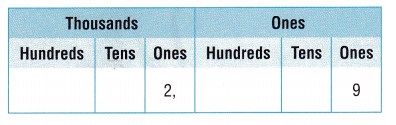
Question 6.
The value of the 8 is ____
Answer: The value of the 8 is Ten thousand
Question 7.
The value of the 4 is ____
Answer: The value of the 4 is Tens.
Question 8.
The value of the 5 is ____
Answer: The value of the 5 is Hundred Thousands
Vocabulary Builder
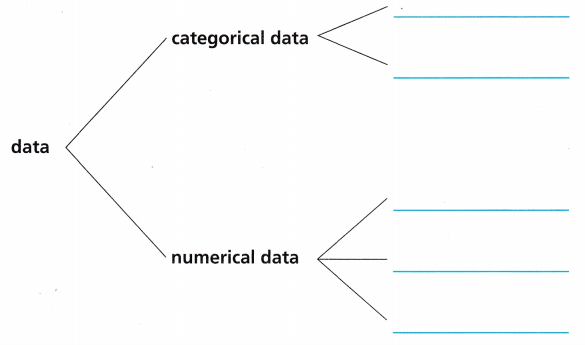
Visualize It
Use the checked words to complete the tree map.
Understand Vocabulary
Complete the sentences using the preview words.
Question 1.
____ is the number of times an event occurs.
Answer: Experimental Probability is the number of times an event occurs.
Question 2.
A ____ would be the best graph to show how many of each of the five types of animals are at the farm.
Answer: A bar graph would be the best graph to show how many of each of the five types of animals are at the farm.
Question 3.
____ is the difference between the greatest and least numbers in a group.
Answer: Range is the difference between the greatest and least numbers in a group.
Question 4.
A graph that shows frequency of data along a number line is a ____
Answer: A graph that shows frequency of data along a number line is a line plot

Question 5.
You can use data to make a _____.
Answer: You can use data to make a data analysis
Question 6.
A ___ shows the relationship between two sets of data.
Answer: A scatter plot shows the relationship between two sets of data.
Reading & Writing
Vocabulary
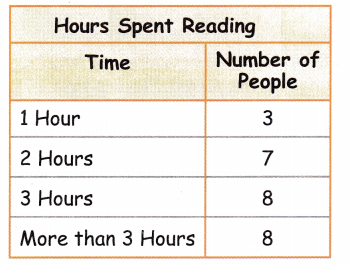
Pictographs and bar graphs are two ways to display data. Each kind of display shows information in a slightly different way.
Look at the data in the table below. Decide whether it would be better to use a pictograph or a bar graph to display the data. Would you need a key? What information would you include in the key? Then make, label, and graph the data set.

Writing For one week, record how much time you spend reading. Write the time you begin and the time you end each day. Then make a bar graph to show the data.

Reading Look for Holes by Louis Sachar in your library.
Answer: Bar graph
Get Ready Game
Penny Drop
Object of the Game Partners can play this game and then make a bar graph to compare their scores.
Materials
- 5 pennies
- Penny Drop Target
- Penny Drop Score Card (one for each player)
- Bar Graph Pattern
Set Up
Give each player one score card.
Number of Players 2
How to Play
- Place the target on the floor. Decide who will go first.
- Players stand face to face with their toes just touching one long edge of the target. Players take turns dropping 5 pennies onto the target.
- When a player has dropped all 5 pennies, he or she adds up their score and records it on the score card.
- A penny will score 0, 2, 5, or 10 points.
- If a penny lands on the border between two areas of the target, it will score the lesser of the two values.
- Repeat Steps 2 and 3. Players add the score to their score from the previous round. The player who has the highest score after 10 rounds wins.
Share Your Thinking Make a bar graph showing your total score for rounds 1 to 10. What information about the game can you get from the graph?