Refer to our Texas Go Math Grade 5 Answer Key Pdf to score good marks in the exams. Test yourself by practicing the problems from Texas Go Math Grade 5 Lesson 16.1 Answer Key Make Dot Plots.
Texas Go Math Grade 5 Lesson 16.1 Answer Key Make Dot Plots
Unlock the problem
Mia recorded the weight of each bag of apples people picked at an apple orchard.
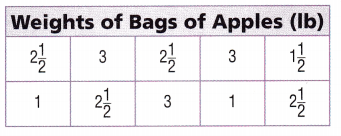
Make a dot plot of the data.
Step 1
List the data in order from least to greatest.
Step 2
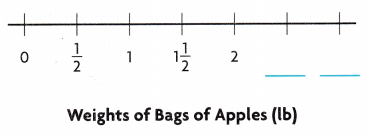
Draw a number line that includes all the numbers on your list.
Step 3
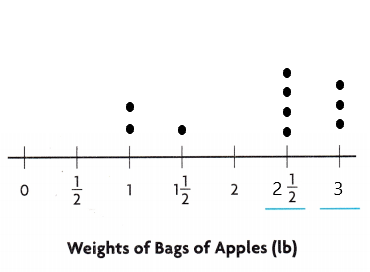
Mark a dot above each number as many times at it occurs on your list. The number 1 occurs 2 times, so mark 2 dots above 1.
Explanation:
Here, the data order from least to greatest is 0, \(\frac{1}{2}\), 1, 1\(\frac{3}{8}\), 2, 2\(\frac{1}{2}\), 3.
The number line is
Math Talk
Describe what you observe about the data more easily in the dot plot than in Mia’s record.
Try This! Make a dot plot using decimal data.
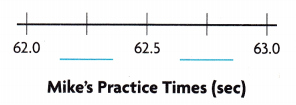
Mike is practicing for a swim meet. His practice times in seconds are 62.5, 63.0, 62.75, 63.0, 63.0, 62.5, 62.5, 62.75, 63.0, 62.0, 62.75, 62.5, 63.0, and 62.5. Make a dot plot of the data.
• List the data in order from least to greatest.
Answers:
62, 62.5, 62.5, 62.5, 62.5, 62.5, 62.75, 62.75, 62.75, 63.0, 63.0, 63.0, 63.0, 63.0.
Explanation:
The data from least to greatest is 62, 62.5, 62.5, 62.5, 62.5, 62.5, 62.75, 62.75, 62.75, 63.0, 63.0, 63.0, 63.0, 63.0.
• Draw a number line that includes all the numbers on your list.
Answer:
The number line that includes all the numbers on the list is 62.25, 62.75.
• Plot the data.
Answer:
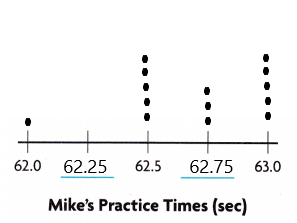
• Explain how you can determine if the dot plot correctly shows the data.
Answer:
Here, we will compare the number of dots above each number on the number line to the number of times that number occurs in the problem.
Share and Show
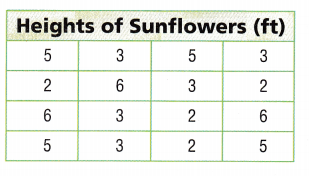
Ana measures the heights of sunflowers in her garden. Use the data for 1-2.
Question 1.
Write the data in order from least to greatest.
_______
Answer:
2,2,2,2,3,3,3,3,3,5,5,5,5,6,6,6.
Explanation:
The data from least to greatest is 2,2,2,2,3,3,3,3,3,5,5,5,5,6,6,6.
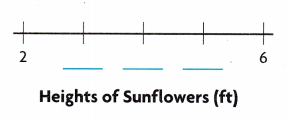
What number will the number line in a dot plot of the data begin with? _____
Answer:
The number is 2.
Explanation:
The number line in a dot plot of the data begins with the number 2.
What number will it end with? _____
Answer:
The number ends with 6.
Explanation:
The number line in a dot plot of the data ends with the number 6.
How many dots will be on the dot plot? _____
Answer:
16 dots.
Explanation:
There are 16 dots on the dot plot.
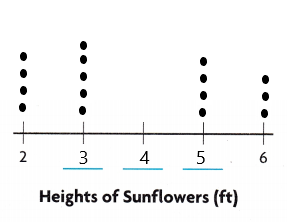
Question 2.
Complete the dot plot of the data.
Answer:
The dot plot is
Math Talk
Explain why there is not a dot above every number on your dot plot.
Problem Solving
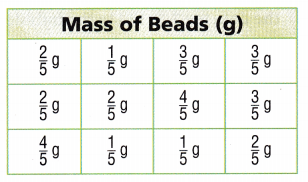
Lily is making a beaded necklace. She makes a list of beads she needs and the mass of each bead. Use the list for 3-4.
Question 3.
Explain how to determine what numbers to put on the number line for a dot plot of the data.
Answer:
Here, we have used a sequence of numbers that includes all the numbers on Lily’s list in the order from least to greatest.
Question 4.
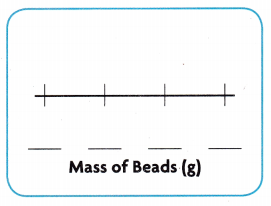
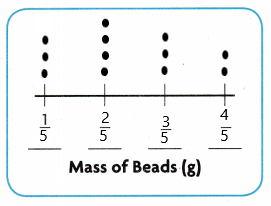
Multi-Step Make a dot plot of the data.
Answer:
The dot plot is
Problem Solving
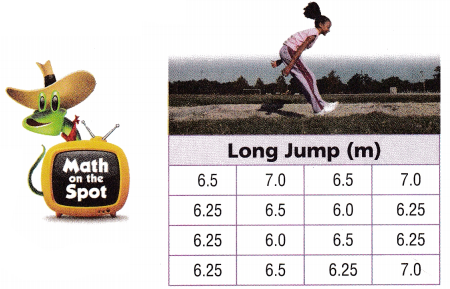
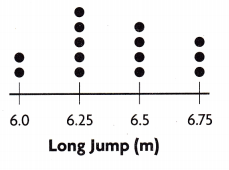
Jeanette kept a record of the distances she Jumped practicing the long jump. She made a dot plot of the data. Use the record and the dot plot for 5-6.
Question 5.
H.O.T. Multi-Step Jeanette made more than one error on the dot plot. Describe and correct the errors.
Answer:
Here, the number 7.0 and its 3 dots are missing and the numbers 6.5 and 6.25 each need one more dot and the number 6.75 does need any dot.
Question 6.
H.O.T. Reasoning If Jeanette jumped each distance shown on the number line an equal number of times, what
rou1d the dot plot look like?
Answer:
An equal number of dots would be above each number.
Daily Assessment Task
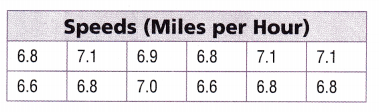
The table shows the speeds of ants that competed in a go-cart race. Use the data for 7-9. Fill in the bubble completely to show your answer.
Question 7.
You are making a dot plot to show the data. Which numbers will you put on the number line for the dot plot?
(A) 6.5, 6.6, 6.7, 6.9, 7.0, 7.1
(B) 6.7, 6.8, 6.9, 7.0, 7.1, 7.2
(C) 6.6, 6.7, 6.8, 6.9, 7.0, 7.1
(D) 6.5, 6.6, 6.7, 6.8, 6.9, 7.0
Answer:
C.
Explanation:
The number we will put on the number line for the dot plot is 6.6, 6.7, 6.8, 6.9, 7.0, 7.1.
Question 8.
How many dots will you mark above 7.1?
(A) 4
(B) 2
(C) 3
(D) 1
Answer:
C.
Explanation:
The number of dots that will be marked above 7.1 is 3.
Question 9.
Multi-Step The go-cart race officials realize that 3 ants in the race should be disqualified. What happens to the dot plot if 3 of the ants with a time of 6.8 miles per hour are removed?
(A) The tallest stack of dots will be above 7.1.
(B) The tallest stack of dots will be above 6.6.
(C) The number of speeds plotted on the dot plot will change to 15.
(D) The dot plot remains the same.
Answer:
A.
Explanation:
The tallest stack of dots will be above 7.1.
Texas Test Prep
Question 10.
Sandy has 12 recipes for trail mix. The amount of peanuts in each recipe in cups is \(\frac{5}{8}\), \(\frac{3}{8}\), \(\frac{3}{8}\), \(\frac{7}{8}\), \(\frac{7}{8}\), \(\frac{5}{8}\), \(\frac{3}{8}\), \(\frac{3}{8}\), \(\frac{7}{8}\), \(\frac{7}{8}\), \(\frac{5}{8}\), and \(\frac{5}{8}\). Sandy makes a dot plot of the
data. Which numbers will she put on the number line?
(A) \(\frac{3}{8}\), \(\frac{4}{8}\), \(\frac{5}{8}\), \(\frac{6}{8}\)
(B) \(\frac{3}{8}\), \(\frac{4}{8}\), \(\frac{6}{8}\), \(\frac{7}{8}\)
(C) \(\frac{4}{8}\), \(\frac{5}{8}\), \(\frac{6}{8}\), \(\frac{7}{8}\)
(D) \(\frac{3}{8}\), \(\frac{4}{8}\), \(\frac{5}{8}\), \(\frac{6}{8}\), \(\frac{7}{8}\)
Answer:
D.
Explanation:
Sandy will put \(\frac{3}{8}\), \(\frac{4}{8}\), \(\frac{5}{8}\), \(\frac{6}{8}\), \(\frac{7}{8}\) numbers on the number line.
Texas Go Math Grade 5 Lesson 16.1 Homework and Practice Answer Key
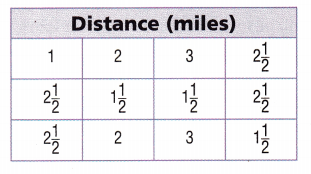
Mrs. O’Malley makes a list to show the miles each dance student travels to the practice center. Use the list for 1-2.
Question 1.
What is the least distance travelled? What is the greatest distance travelled?
Answer:
1 and 3 miles.
Explanation:
The least distance travelled is 1 and the greatest distance travelled is 3 miles.
Question 2.
Make a dot plot of the data.
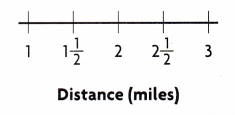
Answer:
Problem Solving
Colton has a list of the length of each song in his favorites playlist. He makes a dot plot of the data. Use the list and the dot plot for 3-4.
Question 3.
Colton counts the number of dots in his dot plot and the data in his list and finds that the numbers are not equal.
Explain Colton’s error and how he can fix it.
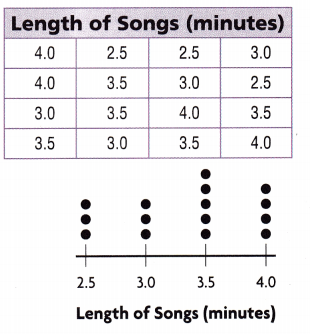
Answer:
Here, the number 3.0 and its 4 dots are missing. We need to place a dot to the number 3.0.
Question 4.
Colton deletes one song with a length of 3.5 minutes from his playlist and adds one song with a length of 4.0 minutes. How will the dot plot of the data change?
Answer:
We will remove a dot from 3.5 and will place a dot on the number 4.0 minutes.
Texas Test Prep
Lesson Check
Fill in the bubble completely to show your answer.
Question 5.
The heights of the girls in Leila’s class to the nearest \(\frac{1}{2}\) inch are: 56\(\frac{1}{2}\), 57, 56\(\frac{1}{2}\), 58, 58, 57\(\frac{1}{2}\), 57\(\frac{1}{2}\), 57, 58\(\frac{1}{2}\), and 57. Leila makes a dot plot of the data. How many different heights will be included on the number line?
(A) 10
(B) 5
(C) 3
(D) 9
Answer:
B.
Explanation:
Given that the heights of the girls in Leila’s class to the nearest \(\frac{1}{2}\) inch are: 56\(\frac{1}{2}\), 57, 56\(\frac{1}{2}\), 58, 58, 57\(\frac{1}{2}\), 57\(\frac{1}{2}\), 57, 58\(\frac{1}{2}\), and 57. Leila makes a dot plot of the data. So there will be 5 different heights will be included on the number line.
Question 6.
A geologist measures the mass of some rocks to the nearest tenth of a gram and makes a dot plot of the data. The masses are: 5.3, 5.5, 5.6, 5.4, 5.4, 5.3, 5.8, 5.7, 5.8, 5.5, 5.5, and 5.3 grams. She lists two numbers on the number line. How many more numbers will she put on the number line?
(A) 2
(B) 3
(C) 4
(D) 5
Answer:
A.
Explanation:
Given that the masses are: 5.3, 5.5, 5.6, 5.4, 5.4, 5.3, 5.8, 5.7, 5.8, 5.5, 5.5, and 5.3 grams and she put two more numbers.
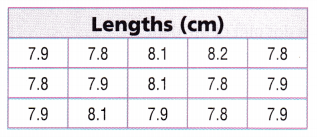
Question 7.
Which numbers will you put on the number line for the dot plot?
(A) 7.8, 7.9, 8.0, 8.1, 8.2
(B) 7.9, 7.8, 8.1, 8.2, 7.8
(C) 7.9, 8.1, 8.2, 8.3, 8.4
(D) 7.8, 7.9, 8.1, 8.2, 8.3
Answer:
A.
Explanation:
We will plot 7.8, 7.9, 8.0, 8.1, 8.2 on the number line for the dot plot.
Question 9.
Multi-Step What is the difference between the total number of dots and the number of dots above the number with the most dots?
(A) 10
(B) 9
(C) 8
(D) 14
Answer:
Question 10.
Multi-Step The paleontologist measures the fossils again and finds two errors. Two fossils with a length of 7.9 centimeters instead measure 8.1 and 8.2 centimeters. Which two numbers will have the same number of dots?
(A) 7.8 and 7.9
(B) 8.0 and 8.2
(C) 7.8 and 8.1
(D) 7.9 and 8.1
Answer:
D.
Explanation:
Given that the paleontologist measures the fossils again and finds two errors. Two fossils with a length of 7.9 centimeters instead measure 8.1 and 8.2 centimeters. So the two numbers will have the same number of dots is 7.9 and 8.1.