Refer to our Texas Go Math Grade 5 Answer Key Pdf to score good marks in the exams. Test yourself by practicing the problems from Texas Go Math Grade 5 Lesson 15.2 Answer Key Analyze Frequency Tables.
Texas Go Math Grade 5 Lesson 15.2 Answer Key Analyze Frequency Tables
Unlock the Problem
You can solve problems by analyzing data in frequency tables.
Example 1.
Students vote for the country they would most like to visit. They record the results in a frequency table.
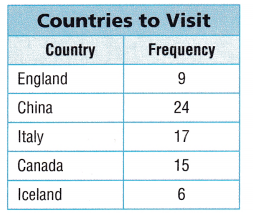
Which two countries have the greatest frequency of votes?
The greatest frequencies are ___ and ____.
The countries with the greatest frequencies are ___ and ___.
Students who vote for the two countries with the greatest frequency of votes will plan a festival about the countries. How many students will plan the festival?
Add the two greatest frequencies.
___ + ___ = ____
So, ____ students will plan the festival.
Answer:
The greatest frequencies are 24 and 17.
The countries with the greatest frequencies are China and Italy.
Students who vote for the two countries with the greatest frequency of votes will plan a festival about the countries. How many students will plan the festival?
Add the two greatest frequencies.
24 + 17 = 41
So, 41 students will plan the festival.
Math Talk
Mathematical Processes
Explain how you could use the frequency table to find the total number of students who voted.
Example 2.
Solve a multi-step problem.
Jason uses a frequency table to keep track of the posters he sells at his online store. He sells movie posters for $12 each and sports posters for $15 each. How much was Jason paid for the movie posters and sports posters he sold in January?
Step 1: Use the frequency table to find the number of movie posters and sports posters Jason sold in January.
movie posters: ___
sports posters: ____
Step 2: Multiply to find how much Jason was paid for each
movie posters: ___ × $___ = $____
sports posters: ___ × $___ = $____
Step 3: Add to find the total amount.
$____ + $____ = $____
Jason was paid $____ for movie posters and sports posters in January.
Answer:
Step 1: Use the frequency table to find the number of movie posters and sports posters Jason sold in January.
movie posters: 12
sports posters: 13
Step 2: Multiply to find how much Jason was paid for each
movie posters: 12 × $12 = $144
sports posters: 13 × $15 = $195
Step 3: Add to find the total amount.
$144 + $195 = $339
Jason was paid $339 for movie posters and sports posters in January.
Share and Show
Students vote for their favorite rides at a water park. They record the results in a frequency table. Use the frequency table for 1-3.
Question 1.
What is the difference between the frequency of votes for Jungle Slide and Splashers?
Jungle Slide: ___ votes
Splashers: ____ votes
The difference is ___ votes.
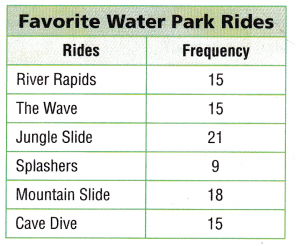
Answer:
Jungle Slide: 21 votes
Splashers: 9 votes
The difference is 12 votes.
Question 2.
Which rides received an equal number of votes?
Answer: River Rapids, The Wave, Cave Dive
Question 3.
How many students voted for Mountain Slide and Cave Dive combined? ____
Answer: 33
Problem Solving
Sandy recorded the fruit snacks she ate each day last month in a frequency table. Use the frequency table for 4-5.
Question 4.
Multi-Step Sandy circled the fruits that she had fewer than 5 times last month. She decided to eat them 3 times as often next month. How many times will she eat each of those fruits?
Answer: Orange 12 times Pear 9 times
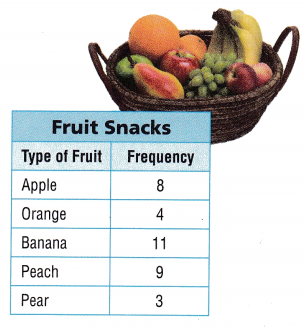
Question 5.
Multi-Step Conic ate fruit as often as Sandy last month and he ate the same types of fruit. But Corne ate each type of fruit an equal number of times. How many times did Corrie eat each type of fruit? Describe the steps you follow to solve the problem.
Answer:
7 Times.
Find the total frequency 8 + 4 + 11 + 9 + 3 = 35
There are five types of fruits 35 ÷ 5 = 7
Problem Solving
Pedro conducts a survey about students’ favorite websites. He records the results in a frequency table. Use the data for 6-7.
Question 6.
How many students are in the survey? Explain how to use mental math to find the answer.
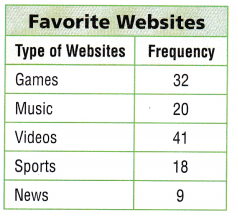
Answer:
120.
Find sums of tens 32 + 18 = 50
41 + 9 = 50
50 + 50 + 20 = 120
Question 7.
H.O.T. Multi-Step Which two types of websites combined received the same number of votes as the type of website with the greatest number of votes? Explain.
Answer:
Games and news websites.
The greatest frequency 41 is for videos. Game websites received 32 votes and news websites received 9 votes
32 + 9 = 41
Daily Assessment Task
Fill in the bubble completely to show your answer.
Question 8.
Analyze Hector has a collection of postcards. The frequency table shows the number of postcards he has from each country. The number of postcards from the United States is 3 times the number he has from which country?
(A) Japan
(B) France
(C) Norway
(D) Canada
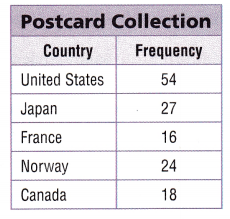
Answer:
(D) Canada
Use the frequency table for 9 and 10.
Question 9.
The table shows the types of sandwiches sold at a deli yesterday. How many more chicken than tuna salad sandwiches were sold?
(A) 12
(B) 7
(C) 13
(D) 19
Answer: (B) 7
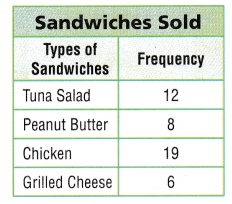
Question 10.
Multi-Step One customer bought half the peanut butter sandwiches and half the grilled cheese sandwiches that were sold. Each sandwich cost $6. How much did the customer pay?
(A) $24
(B) $18
(C) $84
(D) $42
Answer: (D) $42
Texas Test Prep
Question 11.
Students vote for their favorite hobby and record the results in a frequency table.
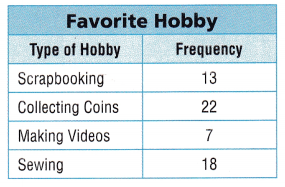
How many students voted for the two most popular hobbies?
(A) 35
(B) 40
(C) 4
(D) 30
Answer: (B) 40
Texas Go Math Grade 5 Lesson 15.2 Homework and Practice Answer Key
Coach Michaels plans the annual school field day. Students vote for their favorite event and he records the results in a frequency table. Use the frequency table for 1-4.
Question 1.
Which event received half the number of votes as water balloon toss? Which event received twice as many votes as water balloon toss?
Answer: Cone toss and Obstacle course
Question 2.
Which two events combined received fewer votes than water balloon toss?
Answer: Relay Race and Cone toss
Question 3.
Which three events combined received fewer Votes than scooter race?
Answer: Relay Race, water balloon toss and Cone toss
Question 4.
Which event do you think Coach Michaels should plan to include in field day? Which event should he consider eliminating? Explain.
Answer:
Problem Solving
A travel website conducts a survey about Texans’ favorite bordering state to visit. Monday’s results are posted in a frequency table. Use the data for 5-6.
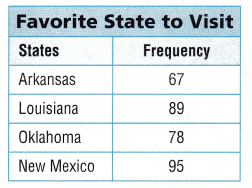
Question 5.
Multi-Step How many more people prefer to visit Louisiana or New Mexico than Arkansas or Oklahoma?
Answer:
people prefer to visit Louisiana = 89
people prefer to visit Arkansas = 67
89 – 67 = 22
people prefer to visit New Mexico = 95
people prefer to visit Oklahoma = 78
95 – 78 = 17
Question 6.
Multi-Step If 256 more people respond to the survey on Tuesday, how many people have responded to the survey so far? Describe the steps you follow to solve the problem.
Answer:
Texas Test Prep
Fill in the bubble completely to show your answer.
Question 7.
Students vote for their favorite type of craft project and record the results in a frequency table. What is the difference in frequency between the least favorite craft and the craft with the most votes?
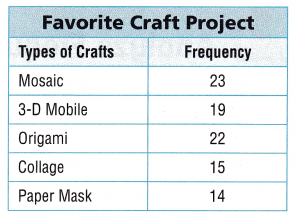
(A) 9
(B) 1
(C) 37
(D) 8
Answer:
15 – 14 = 1
Thus the correct answer is option B.
Question 8.
Students vote for their favorite location for a field trip. Which two locations have the least difference in the frequency?
(A) Aquarium and Zoo
(B) Zoo and Science Museum
(C) Theater and Art Museum
(D) Aquarium and Theater
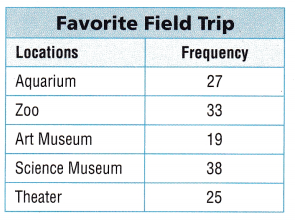
Answer: (D) Aquarium and Theater
The table shows the types of bagels sold at the bagel shop on Friday. Use the frequency table for 9-11.
Question 9.
One eighth of the number of raisin bagels sold on Friday were sold on Saturday. How many raisin bagels were sold on Saturday?
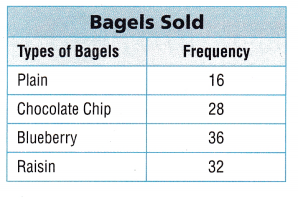
Answer:
Given,
One eighth of the number of raisin bagels sold on Friday were sold on Saturday.
32/8 = 4
Thus 4 raisin bagels were sold on Saturday.
Question 10.
Multi-Step Sasha buys bagels for her garage sale customers. She buys all the chocolate chip bagels and half the plain bagels. Each bagel costs $2.50. How much does Sasha spend on bagels?
(A) $70
(B) $20
(C) $90
(D) $110
Answer:
Given,
Sasha buys bagels for her garage sale customers.
She buys all the chocolate chip bagels and half the plain bagels.
Each bagel costs $2.50.
Number of chocolate chip bagels = 28
28 × 2.50 = 70
Half of plain bagels = 8 × 2.50 = 20
70 + 20 = 90
(C) $90
Thus the correct answer is option C.
Question 11.
Multi-Step If the total number of bagels sold on Friday was double the number of bagels sold on Saturday, how many bagels were sold on Saturday?
(A) 112
(B) 51
(C) 56
(D) 224
Answer:
Total number of bagels = 112
Double of number of bagels = 112 × 2 = 224
Thus the correct answer is option D.