Refer to our Texas Go Math Grade 4 Answer Key Pdf to score good marks in the exams. Test yourself by practicing the problems from Texas Go Math Grade 4 Lesson 17.6 Answer Key Use Stem-and-Leaf Plots.
Texas Go Math Grade 4 Lesson 17.6 Answer Key Use Stem-and-Leaf Plots
Essential Question
How do you solve problems using a stem-and-leaf plot?
Answer:
Step 1:
Find the least number and greatest number in the data set.
Step 2:
Draw the vertical line and write the digits in the tens places from 1 to 3 on the left of the line.
Unlock the Problem
Example 1
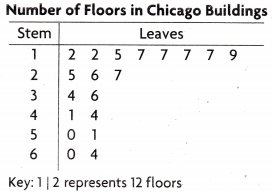
While doing research for a project, Lila made a stem-and-leaf plot of the number of floors that different buildings in Chicago have. How many buildings have more than 40 floors?
Think: 41 is represented by 4 | 1 on the stem-and-leaf plot.
The number of floors in the buildings that have more than 40 floors are: _______________
So, ___________ buildings have more than 40 floors.
Answer:
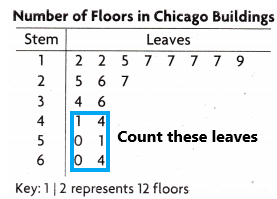
The number of floors in the buildings that have more than 40 floors is 6.
Count the number of leaves that are after stems 4, 5, 6.
So, 6 buildings have more than 40 floors.
Example 2
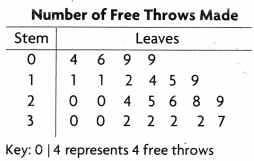
Each time Glenda practised her free throws, she recorded the number of made baskets in a stem-and-leaf plot. Flow many times did Glenda make more than 20 free throws?
The number of times Glenda practised her free throws and made more than 20 of them was: ______________
So, Glenda made more than 20 free throws ______________ times.
Answer:
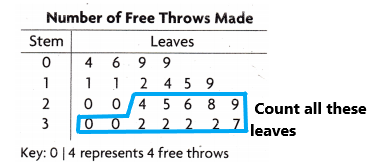
The number of times Glenda practised her free throws and made more than 20 of them was: 12
So, Glenda made more than 20 free throws 12 times.
Share and Show
Use the stem-and-leaf plot for 1-3.
Question 1.
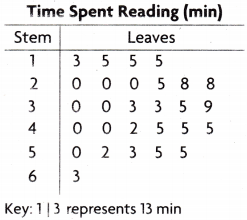
Martin kept track of the time he spent reading in a stem-and-leaf plot. How many times did Martin read for 40 or more minutes?
Think: Count the number of leaves that are after stems 4, 5, 6.
Martin read for 40 or more minutes ____________ times.
Answer:
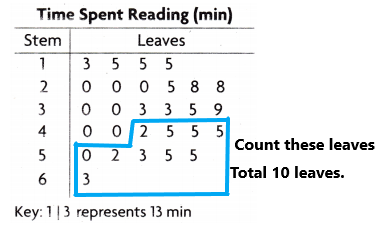
Martin read for 40 or more minutes 10 times.
Need to count more than 40.
count the leaves of 4 are 2, 5, 5, 5
Count the leaves for 5 are 0, 2, 3, 5, 5.
Count the leaves for 6 are 3.
Question 2.
How many times did Martin read for less than 30 minutes?
Answer:
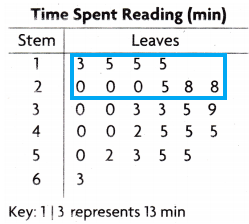
The question asked the number of times did martin read for less than 30 minutes. So, I circled stem 1 and 2 leaves.
Count the number of leaves of the stem 1 is 3, 5, 5, 5.
Count the number of leaves of stem 2 are 0, 0, 0, 5, 8, 8.
The total number of leaves of stem 1 is 4
The total number of leaves of stem 2 is 6
The number of times did martin read for less than 30 minutes is 6+4=10.
Therefore, he read 10 times.
Question 3.
How many more times did Martin read for less than 39 minutes than he read for more than 39 minutes?
Answer:
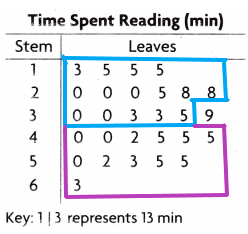
The blue line represents less than 39 minutes.
The pink line represents more than 39 minutes.
Count the number of leaves of stem 1 is 3, 5, 5, 5.
Count the number of leaves of stem 2 is 0, 0, 0, 5, 8, 8.
Count the number of leaves of stem 3 is 0, 0, 3, 3, 5. (I didn’t return 9 here because here asked less than 39 minutes).
Count the number of leaves of stem 4 is 0, 0, 2, 5, 5, 5.
Count the number of leaves of stem 5 is 0, 2, 3, 5, 5.
Count the number of leaves of stem 6 is 3.
The total number of leaves of stem 1 is 4.
The total number of leaves of stem 2 is 6.
The total number of leaves of stem 3 is 5.
The total number of leaves of stem 4 is 6.
The total number of leaves of stem 5 is 5.
The total number of leaves of stem 6 is 1.
The total number of leaves is less than 39 are 15.
The total number of leaves is more than 39 are 12.
Subtract those two numbers to get the answer.
The number of times did Martin read for less than 39 minutes than he read for more than 39 minutes:15-12=3.
Therefore, 3 more times.
Math Talk
Mathematical Processes
Explain how you found the answer to Problem 3.
Answer:
Step 1: Count the leaves that are present in less than 39 minutes.
Step 2: Count the leaves that are presently more than 39 minutes.
Step 3: Count the total leaves of less than 39 minutes.
Step 4: Count the total leaves of more than 39 minutes.
Step 5: Subtract the two numbers and then get the answer.
Problem Solving
Use the stem-and-leaf plot for 4-7.
Question 4.
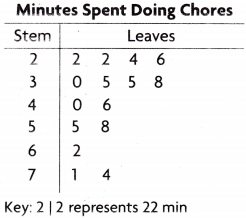
Stephanie asked her 23 classmates how much time they spent doing chores in a week. She recorded the data in a stem-and-leaf plot. How many classmates said that they spend some time doing chores in a week?
Answer:
Count all the leaves.
Count the number of leaves of stem 2 is 2, 2, 4, 6.
Count the number of leaves of stem 3 is 0, 5, 5, 8.
Count the number of leaves of stem 4 is 0, 6.
Count the number of leaves of stem 5 is 5, 8
Count the number of leaves of stem 6 is 2.
Count the number of leaves of stem 7 is 1, 4.
Now count all the leaves of stem 2, 3, 4, 5, 6, 7 is 15.
Therefore, 15 classmates said they spend time doing chores in a week.
Question 5.
How many of Stephanie’s classmates said they did more than an hour of chores a week?
Answer:
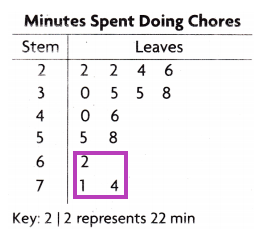
There are 3 classmates who do chores for more than an hour a week. These can be explained in detail and also represented in the above diagram.
6| 2 represented as 62 minutes. (1 hour 2 minutes, it is more than an hour)
7| 1 represented as 71 minutes.
7| 4 represented as 74 minutes.
Now count all those leaves of stem 6 and 7:2, 1, 4
The total number of leaves: 3.
Question 6.

H.O.T. Multi-Step how many classmates said that they spent more than 20 minutes and less than 40 minutes doing chores a week?
Answer:
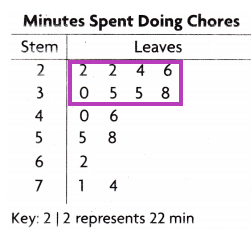
There are 8 classmates who spend more than 20 minutes and less than 40 minutes. These can be explained in detail and also represented in the above diagram:
The leaves of stem 2 are 2, 2, 4, 6.
The leaves of stem 3 are 0, 5, 5, 8.
2| 2 represented as 22 minutes.
2| 2 represented as 22 minutes.
2| 4 represented as 24 minutes.
2| 6 represented as 26 minutes.
3| 0 represented as 30 minutes.
3| 5 represented as 35 minutes.
3| 5 represented as 35 minutes.
3| 8 represented as 38 minutes.
These all represent more than 20 minutes and less than 40 minutes. So I circled, leaves of stems 2 and 3.
Now count all the leaves of 2 and 3: 8.
Question 7.
How many classmates said they didn’t do any chores? Explain your answer.
Answer:
There are no students who said that they don’t do any chores. The table also gives the time of classmates who are doing chores in a week. There is no representation of not doing chores.
Use the stem-and-leaf plot for 8-10.
Question 8.
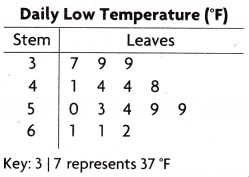
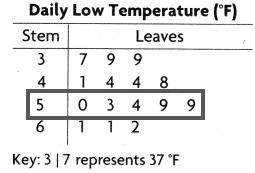
Tina records the daily low temperature for 15 days.
She recorded the data in the stern-and-leaf plot.
How many days was the low temperature in the 50s?
Answer:
Explanation:
The low temperature in the 50s was 5 days.
Count all the leaves of stem 5 are 0, 3, 4, 9, 9.
Question 9.
Use Graphs On how many days was the daily low temperature in the 30s and 40s?
Answer:
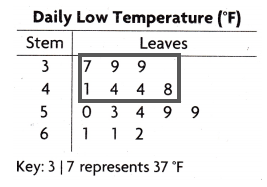
The number of days the daily low temperature in the 30s and 40s:7
Count the leaves of stem 3: 7, 9, 9.
Count the leaves of stem 4: 1, 4, 4, 8.
3| 7 represents 37 degrees.
3| 9 represents 39 degrees. Likewise, write all the keys for better understanding.
The total number of leaves of 3 and 4 stems are 7.
Question 10.
H.O.T. Use Math Language Explain how to find how many more days the low temperature was greater than 53°F than less than 53°F.
Answer:
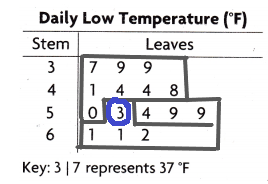
The days the low temperature was greater than 53 degrees are 8.
The days the low temperature was lesser than 53 degrees are 6.
Count the leaves of 3, 4 and 5 stems. In 5th stem up to zero only because here asked less than 53 degrees.
Count the leaves of 5 and 6 stems. In 5th stem count after 3 onwards because here asked greater than 53 degrees.
Now subtract the days:8-6=2.
Therefore, 2 days more the low temperature was greater than 53°F than less than 53°F.
Use the stem-and-leaf plot for 11-14.
Question 11.
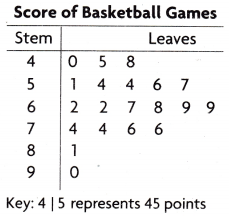
Nick recorded the number of points his basketball team scored during their season in a stem-and-leaf plot. How many games did Nick’s basketball team play?
Answer:
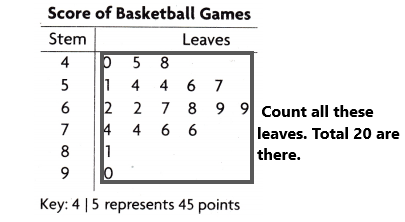
The team played 20 games.
Count all the leaves of the stem 4, 5, 6, 7, 8, 9.
Question 12.
During how many games did Nick’s team score between 55 and 75 points?
Answer:
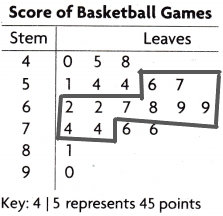
The number of games did Nick’s team score between 55 and 75 points:10.
Count the leaves of stem 5, 6, and 7. The question asked was between 55 and 75. This means we can count from 56 to 74. So, when we count 56 to 74 then we will get the answer. I represented in the above diagram. Count those numbers which I marked in the diagram.
Question 13.
Multi-Step During how many more games did Nick’s team score less than 68 points than they scored more than 68 points?
Answer:
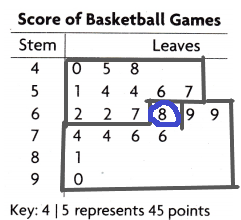
6| 8 represents 68 points.
The number of games Nick’s team score less than 68 points=11
The number of games Nick’s team score more than 68 points=8
Count the leaves more than 68 and less than 68 that I represented in the above diagram.
Subtract both points to get the answer.
The number of more games did Nick’s team score less than 68 points than they scored more than 68 points=11-8=3.
Therefore, in 3 more games, Nick’s team score less than 68 points than more than 68 points.
Question 14.
Reasoning Explain how the stem-and-leaf plot would change if Nick’s basketball team played 8 more games and they scored more than 65 points each game?
Answer:
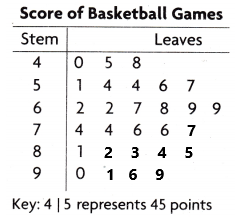
Explanation:
If Nick’s team played 8 more games then total they played 28 games.
And they scored all the games more than 65 points. Then the stem and leaf plot might be like in the above diagram. I added some more leaves more than 65 and If we count all the leaves now the total games are 28.
Daily Assessment Task
Fill in the bubble completely to show your answer.
Question 15.
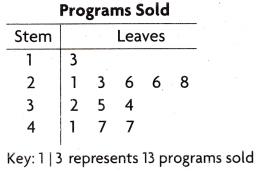
The stem-and-leaf plot at the right shows the number of programs that different vendors sold during a sporting event. How many vendors sold between 20 and 30 programs?
(A) 1
(B) 4
(C) 5
(D) 3
Answer: Option C is correct.

Explanation:
Count all the leaves between 20 and 30.
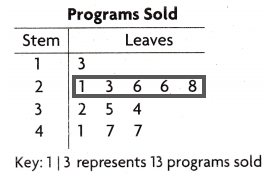
The leaves between 20 and 30 are 1, 3, 6, 6, 8.
Use the stem-and-leaf plot for 16-17.
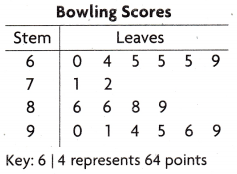
The stem-and-leaf plot at the right shows the bowling scores for members of a bowling team.
Question 16.
What is the highest score that is bowled?
(A) 69
(B) 99
(C) 78
(D) 95
Answer: Option B is correct.

Explanation:
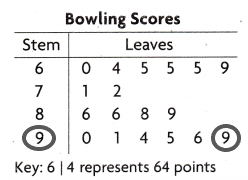
9| 9 represents 99 points.
This is the highest point in the table.
Question 17.
Multi-Step How many team members bowled a 64 or a 65?
(A) 0
(B) 4
(C) 2
(D) 3
Answer: Option B is correct.

Explanation:
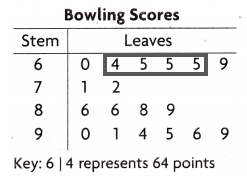
Count the marked leaves because they can be represented as:
6| 4 represents 64 points.
6| 5 represents 65 points.
6| 5 represents 65 points.
6| 5 represents 65 points.
TEXAS Test Prep
Question 18.
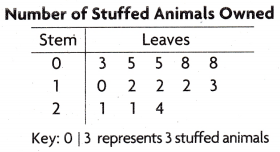
The stem-and-leaf plot at the right shows the number of stuffed animals Sara and her friends have. How many of Sara’s friends have more than 10 stuffed animals?
(A) 12
(B) 6
(C) 8
(D) 7
Answer: Option D is correct.

Explanation:
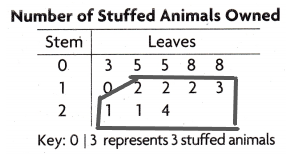
Count the leaves having more than 10.
7 of Sara’s friends have more than 10 stuffed animals.
Texas Go Math Grade 4 Lesson 17.1 Homework and Practice Answer Key
Question 1.
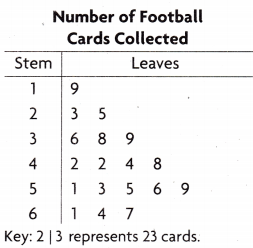
Blake used a stern-and-leaf plot to record the number of football cards that he and his friends have collected. how many friends have collected 50 or more cards?
Answer: 8 friends collected.
Explanation:
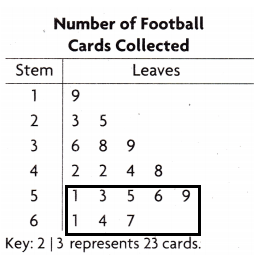
Count the leaves of stem 5 and stem 6.
The leaves of stem 5 are 1, 3, 5, 6, 9.
The leaves of stem 6 are 1, 4, 7.
Count all those leaves to get the answer.
Total leaves are 8.
Question 2.
How many friends have collected 25 or fewer cards?
Answer: 3 friends collected.
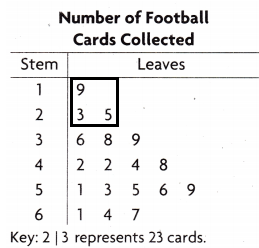
count the leaves of stem 1 and stem 2.
The question asked 25 or 25 fewer. So we need to count 25 also.
1| 9 represents 19 cards.
2| 3 represents 23 cards.
2| 5 represents 25 cards.
Total 3 friends collected.
Question 3.
How many friends have collected between 30 and 50 cards?
Answer: 7 friends have collected between 30 and 50 cards.
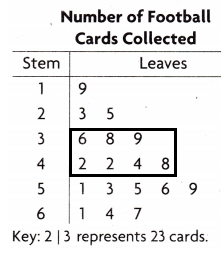
Count the leaves of stem 3 and stem 4 because the question asked friends collected between 30 and 50. So, we need to count from 30 to 50. Check the numbers having 30 to 50. I circled in the above diagram. Count those leaves. The total leaves are 7.
Question 4.
Multi-Step How many more friends have collected more than 40 cards than less than 40 cards?
Answer: 6 more cards friends have collected.
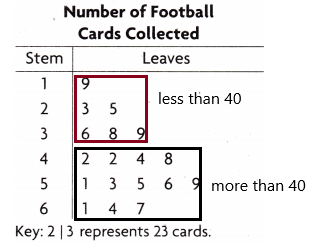
First, we need to write the leaves having less than 40.
The leaves of stem 1 are 9
The leaves of stem 2 are 3, 5
The leaves of stem 3 are 6, 8, 9
Now write the leaves having more than 40.
The leaves of stem 4 are 2, 2, 4, 8
The leaves of stem 5 are 1, 3, 5, 6, 9
The leaves of stem 6 are 1, 4, 7
Count the leaves less than 40:6
Count the leaves more than 40:12
Subtract those two numbers: 12-6=6.
Problem Solving
Question 5.
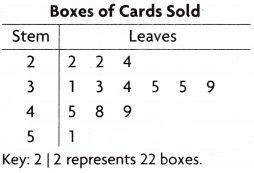
The girls on Stacy’s soccer team sold boxes of cards to raise money for new uniforms. Stacy recorded data about their sales in a stem-and-leaf plot. How many girls sold more than 30 boxes of cards?
Answer: 10 girls sold more than 30 boxes of cards.
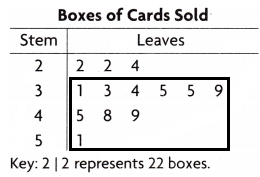
Count the number of leaves having more than 30 boxes.
3| 1 represents 31 boxes of cards.
3| 3 represents 33 boxes of cards. Likewise, write up to 5| 1. These all are more than 30. Count the leaves.
The total leaves are 10.
Question 6.
What is the greatest number of boxes sold by one girl?
Answer:
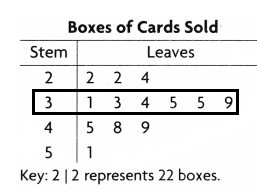
The greatest number of boxes are 6.
Count the leaves of stem 3 are 1, 3, 4, 5, 5, 9.
Stem 3 has the highest number of boxes sold by one girl.
Question 7.
H0w many girls on the team sold cards? Explain.
Answer: 58 girls.
Count the total leaves in the given stem and leaf plot diagram.
Question 8.
Explain how the stem-and-leaf plot would change if another girl on Stacy’s soccer team sold 60 boxes of cards.
Answer:
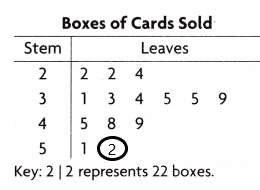
I added 2 in the stem 5. Then a total of 60 is there. I think the stem-and-leaf plot would change if another girl on Stacy’s soccer team sold 60 boxes of cards.
Lesson Check
Fill in the bubble completely to show your answer.
Use the table at right for 9-11.
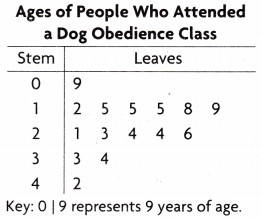
Question 9.
The stern-and-leaf plot at the right shows the ages of people who attended a dog obedience class. How many people were between 20 and 40 years old?
(A) 7
(B) 5
(C) 8
(D) 6
Answer: Option A is correct.

Explanation:
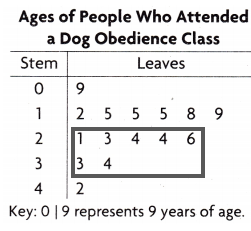
Count all the leaves present in stems 2 and 3.
There are 7 people were between 20 and 40 years old.
Question 10.
Which age group was most widely represented at the class?
(A) teens
(B) twenties
(C) thirties
(D) forties
Answer: Option A is correct.

Explanation:
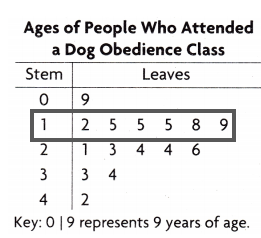
the stem 1 is having the highest number of leaves.
Question 11.
Multi-Step How many people were more than 20 years old than were less than 20 years old?
(A) 8
(B) 1
(C) 2
(D) 7
Answer: Option B is correct.

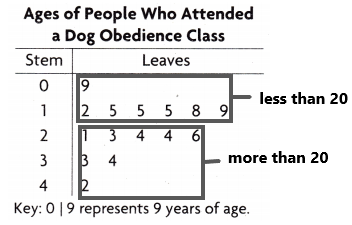
The leaves of stem 0 are 9
The leaves of stem 1 are 2, 5, 5, 5, 8, 9.
The leaves of stem 2 are 1, 3, 4, 4, 6
The leaves of stem 3 are 3, 4.
The leaves of stem 4 are 2
The total number of leaves that are less than 20=7.
The total number of leaves that are more than 20=8.
Subtract both the numbers: 8-7=1.
Use the table at right for 12-14.
Question 12.
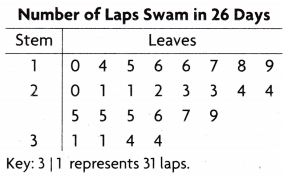
Kyle kept track of the number of laps he swam each day. He used a stem-and-leaf plot to display his data. What is the greatest number of laps that Kyle swam in one day?
(A) 44
(B) 34
(C) 26
(D) 43
Answer: Option B is correct.

Explanation:
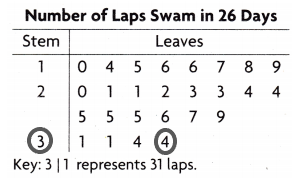
The largest number is 34.
3| 4 represents 34.
Question 13.
Multi-Step How many days did Kyle swim 30 or more laps?
(A) 1 days
(B) 3 days
(C) 2 days
(D) 4 days
Answer: Option D is correct.

Explanation:
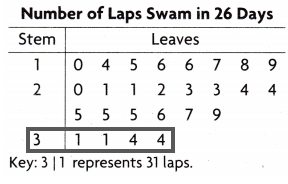
Count the leaves having 30 0r more than 30.
There are 4 days Kyle swim more than 30 laps.
Question 14.
Multi-Step How many days did Kyle swim 23, 24, or 25 laps?
(A) 3 days
(B) 7 days
(C) 11 days
(D) 9 days
Answer: Option B is correct.

Explanation:
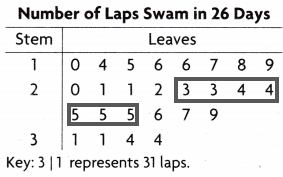
Count all the 3s, 4s, 5s present in stem 2.
There are 7 days did Kyle swim 23, 24, or 25 laps