Refer to our Texas Go Math Grade 4 Answer Key Pdf to score good marks in the exams. Test yourself by practicing the problems from Texas Go Math Grade 4 Lesson 17.4 Answer Key Use Dot Plots.
Texas Go Math Grade 4 Lesson 17.4 Answer Key Use Dot Plots
Essential Question
How do you use dot plots to answer questions involving whole numbers, fractions, and decimals?
Answer:
1. I can use a dot plot to represent the distribution of a data set and answer questions about the real-world situation.
2. I can use the centre and spread to describe data sets, including what is typical in a data set.
Unlock the Problem
You can use a dot plot to organize data to make the data visually
Example 1
The dot plot shows the lengths of the buttons in Jen’s collection. For an art project, she wants to know how many buttons in her collection are longer than \(\frac{1}{4}\). How can she use a dot plot to find the answer?
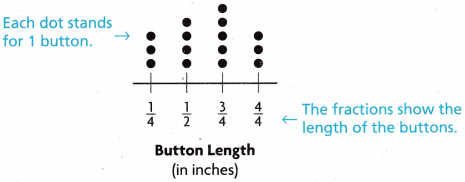
Count the number of dots above each of the button lengths on the dot
plot. There are ___3________ dots above \(\frac{1}{4}\), ____4____ dots above \(\frac{1}{2}\), ____5_______ dots above \(\frac{3}{4}\), and ____3_____ dots above \(\frac{4}{4}\).
Since you are trying to find the number of buttons that have a length greater than _other buttons_, count the number of dots above the other fractions to find the answer.
So, ___________ buttons in Jen’s collection are longer than \(\frac{1}{4}\)inch.
Answer:
Count the number of dots above each of the button lengths on the dot
plot. There are 3 dots above \(\frac{1}{4}\), 4 dots above \(\frac{1}{2}\), 5 dots above \(\frac{3}{4}\), and 3 dots above \(\frac{4}{4}\).
Since you are trying to find the number of buttons that have a length greater than _other buttons_, count the number of dots above the other fractions to find the answer.
So, 12 buttons in Jen’s collection are longer than \(\frac{1}{4}\)inch.
Question 1.
How many buttons does Jen have in her collection?
Answer:
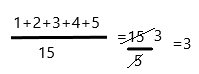
Add all the dots present above the dotted line: 3+4+5+3=15
Therefore, 15 buttons are there in her collection.
Question 2.
How many buttons are less than \(\frac{3}{4}\) inch long?
Answer:
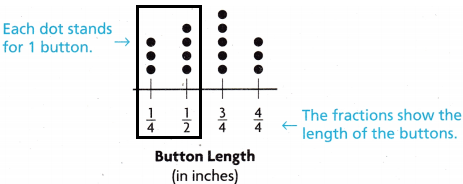
7 buttons are less than \(\frac{3}{4}\) inch.
add all the dots which are present in the less than \(\frac{3}{4}\) inch that are 1/2, 1/4: 4+3=7.
Question 3.
What is the difference in length between the longest button and the shortest button in Jen’s collection? ___________
Answer:
The longest button is 4/4=3
The shortest button is 1/4=3
Both are equal, there is no difference between them.
Example 2 Solve a multi-step problem.
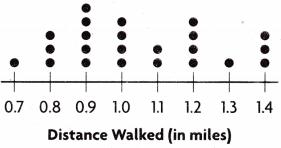
Some of the students in Ms. Lee’s class walk around the track during recess. The dot plot shows the distances that the students walked. How many more students walked 1 or more miles than walked less than a mile?
STEP 1
Count the number of dots above 0.7, 0.8, and 0.9.
___________ students walked less than ___________ mile.
Answer:
The number of dots above 0.7, 0.8, and 0.9:1+3+5=9.
9 students walked less than a mile.
STEP 2
Count the number of dots above 1.0, 1.1, 1.2, 1.3, and 1.4: 4+2+4+1+3=14.
Therefore, 14 students walked mile or more.
STEP 3
___________ – ___________ = ___________
So, ___________ more students walked 1 or more miles than walked less than a mile.
Answer:
14-9=5
So, 5 more students walked 1 or more miles than walked less than a mile.
Share and Show
Question 1.
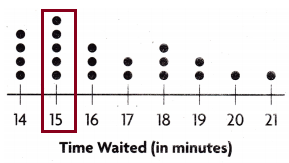
A restaurant manager collected data on the lengths of time customers waited for their food. He represents the data he collected in a dot plot. How many customers waited for 15 minutes for their food?
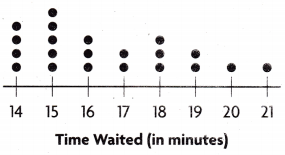
Think: Count the number above the 15.
There are __________ dots above the 15 on the dot plot.
So, ___________ people waited 15 minutes for their food.
Answer:
There are 5 dots above the 15 on the dot plot. So, 5 people waited 15 minutes for their food.
Question 2.
Flow many people did the restaurant manager collect data about?
Answer:
Add all the dots present above the 14, 15, 16, 17, 18, 19, 20, 21:
4+5+3+2+3+2+1+1=21.
Therefore, he collected about 21 people.
Question 3.
How many people waited 17 minutes or less for their food?
Answer:
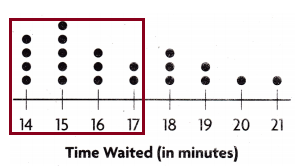
The people waited 17 minutes or less for their food is: 17, 16, 15, 14
add all the dots presented above the dot line:2+3+5+4=14.
Therefore, 14 people have waited.
Question 4.
How many more people waited 17 minutes or less than waited 19 minutes or more?
Answer:
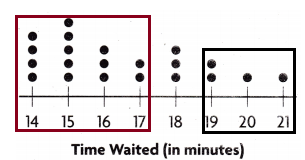
The people waited for 17 or less=2+3+5+4=14
The people waited for 19 or more=2+1+1=4
The people waited 17 minutes or less than waited 19 minutes or more
:14-4=10
Therefore, 10 people have waited.
Problem SoIving.
Use the dot plot for 5 – 6.
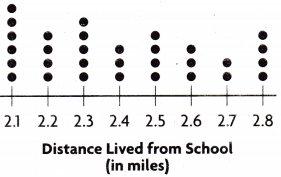
Question 5.
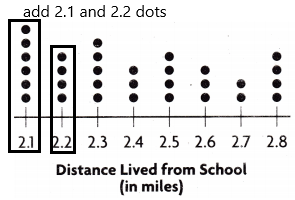
Use Graphs A school collected data from some students about how far they live from the school. How many students live either 2.1 01 2.2 miles from the school?
Answer: 10 students.
10 students live either 2.1 or 2.2 miles from the school.
add all the dots present above the number line 2.1 and 2.2=6+4=10.
Question 6.
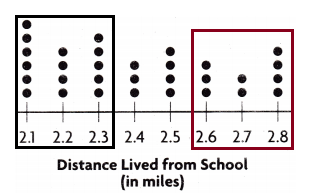
H.O.T. Apply Multi-Step Martha wants to know how many more students live more than 2.0 and less than 2.4 miles from school than live more than 2.5 and less than 2.9 miles from school. Explain how Martha will determine the answer.
Answer:
The students live more than 2.0 and less than 2.4=6+4+5=15.
The students live more than 2.5 and less than 2.9=3+2+4=9.
The number of more students who live more than 2.0 and less than 2.4 miles from school than live more than 2.5 and less than 2.9 miles from school=15-9=6.
Unlock the Problem
Question 7.

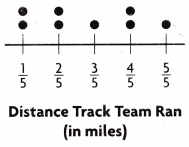
H.O.T. Multi-Step The dot plot shows the distances some of the track team Ian to practice for an upcoming track meet, in miles. Altogether, did the students run more or less than 5 miles?
Answer:
The students run altogether more or less than 5 miles. So, add all the dots present above the dot plot:2+2+1+2+1=8.
Therefore, 8 students run together.
a. What are you asked to find?
Answer: Are the students run more or less than 5 miles together?
b. What information do you need to use?
Answer: By using a dot plot we can get the answer.
c. How will the dot plot help you solve the problem?
Answer:
A dot plot has total information which we can count the number of students and distances are also given. By using that data we can solve the problem.
d. Show the steps to solve the problem.
Answer:
Step 1: count the dots present above the dot plots those are 1/5, 2/5, 3/5, 4/5, 5/5.
The dots are:2, 2, 1, 2, 1.
Step 2: total 8 students run together.
e. Complete the sentences. The team members ran a total of ___________ miles.
Since ___________ miles ___________ 5 miles, the students ran ___________ than 5 miles.
Answer:
The team members ran a total of 3 miles.
add all the distances: 1/5+2/5+3/5+4/5+5/5
Since 3 miles less than 5 miles, the students ran less than 5 miles.
Daily Assessment Task
Fill in the bubble completely to show your answer.
Use the dot plot for 8-11.
Aaron and his family took a trip to a national park.
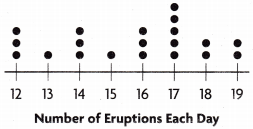
He made a dot plot to show the number of eruptions made by a geyser each day for 20 days.
Question 8.
How many eruptions occurred the most number of days?
(A) 18
(B) 14
(C) 17
(D) 16
Answer: Option C is correct.

Explanation: The representation is shown below diagram.
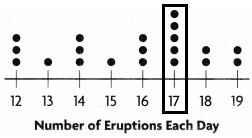
17 number of eruptions occurred the most number of days.
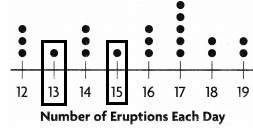
Question 9.
What is the least number of eruptions the geyser has in one day?
(A) 18
(B) 15
(C) 13
(D) 12
Answer: Option B and C are correct.
Both are having the same number of eruptions in one day that is 1.

Explanation: Diagram representation:
Question 10.
Multi-Step How many more times does the geyser have 17 daily eruptions than it has 15 and 16 eruptions combined?
(A) 3
(B) 1
(C) 2
(D) 5
Answer: Option B is correct.

Explanation:
The 17 daily eruptions are 5
The 15 and 16 eruptions combines=3+1=4
many more times does the geyser have 17 daily eruptions than it has 15 and 16 eruptions combined:5-1=4.
TEXAS Test Prep
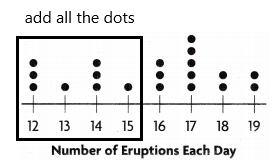
Question 11.
How many times did Aaron and his family see either 12, 13 14 or 15 eruptions?
(A) 8
(B) 9
(C) 7
(D) 12
Answer: Option A is correct.

Explanation:
Add all the dots present above the 12, 13, 14, 15=3+1+1+3=8.
Texas Go Math Grade 4 Lesson 17.4 Homework and Practice Answer Key
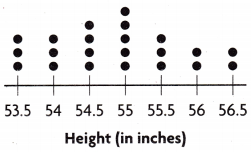
Question 1.
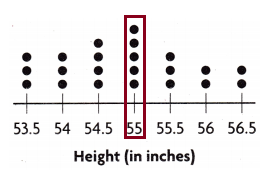
Mr. Dominguez collected data on the heights of the students in his class. He represents the data he collected in a dot plot. How many students are 54.5 inches tall?
Answer:
4 students are 54.5 inches tall.
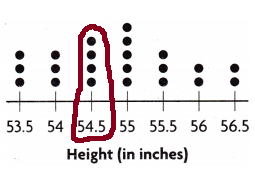
Count the dots above the 54.5 inches.
Question 2.
How many students did Mr. Dominguez collect data about?
Answer:
The Dominguez collects data about 7 different heights.
The heights are 53.5, 54, 54.5, 55, 55.5, 56, 56.5
To know the number of students count all the dots above the heights.
The dot plots for 53.5=3
The dot plots for 54=3
The dot plots for 54.5=4
The dot plots for 55=5
The dot plots for 55.5=3
The dot plots for 56=2
The dot plots for 56.5=2
Add all the dot plots:3+3+4+5+3+2+2=22.
Therefore, he collects the data about 22 students.
Question 3.
How many students are more than 55 inches tall?
Answer:
There are 7 students who are more than 55 inches tall.
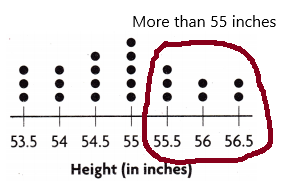
add all the dots above the 55.5, 56, 56.5 inches. Because in the question asked the number of students are there more than 55 inches tall.
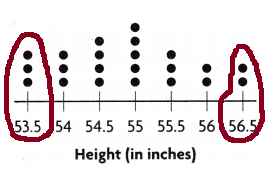
Question 4.
How many students are more than 56 inches tall or less than 54 inches tall?
Answer:
The number of students more than 56 inches tall=2 (56.5 inches students)
The number of students less than 54 inches tall=3 (53.5 inches students)
Question 5.
What is the height of the most students in the class?
Answer:
For most of the students, the height is 55 inches. I represent in the below diagram:
Question 6.
What is the difference between the number of students who are 55 inches or less tall and students who are more than 55 inches tall?
Answer:
The students who are 55 or less tall are 55, 54.5, 54, 53.5
The students who are 55 or more tall are 55, 55.5, 56, 56.5
Now add who are 55 or less=5+4+3+3=15.
Add who are 55 or more tall=5+3+2+2=12
The difference between them is 15-12=3.
Problem Solving
Question 7.
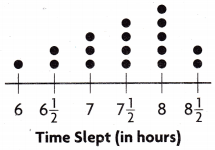
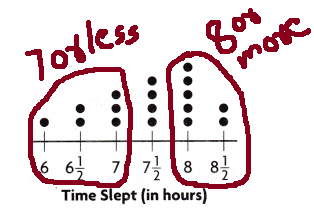
Adam asked several people how many hours they slept each night. He represents the data he collected in a dot plot. How many hours of sleep do most of the people sleep?
Answer:
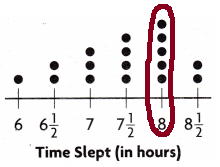
8 hours of sleep do most of the people sleep.
Question 8.
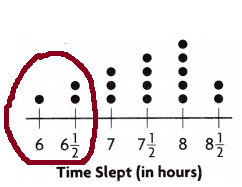
How many people sleep less than 7 hours each night?
Answer:
3 people sleep less than 7 hours each night.
Question 9.
Multi-Step How many more people sleep 8 or more hours than people who sleep 7 or fewer hours? Explain.
Answer:
The people sleep 8 or more hours=5+2=7
The people sleep 7 or fewer hours=3+2+1=6
more people sleep 8 or more hours than people who sleep 7 or fewer hours=7-6=1.
Therefore, 1 more person sleep.
Lesson Check
Fill in the bubble completely to show your answer. Use the dot plot for 10-12.
Question 10.
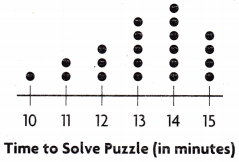
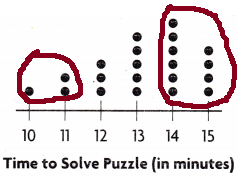
Mrs. Sanders gave her students a puzzle to solve. She made a dot plot to show the number of minutes it took for her students to solve the puzzle. How many students solved the puzzle in less than 15 minutes?
(A) 21
(B) 11
(C) 4
(D) 17
Answer: Option D is correct.

Explanation: Add all the dots present in the number line which are less than 15 means add the dots of 10, 11, 12, 13, 14.
Therefore, 1+2+3+5+6=17.
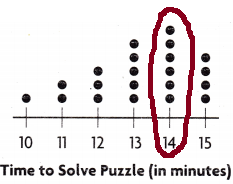
Question 11.
What number represents the time that the greatest number of students solved the puzzle?
(A) 12
(B) 13
(C) 14
(D) 15
Answer: Option C is correct.

Explanation: The number that represents the time that the greatest number of students solved the puzzle is 14.
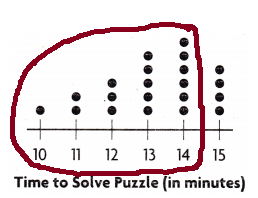
Question 12.
Multi-Step How many more students solved the puzzle in 14 or more minutes than solved the puzzle in 11 or less minutes?
(A) 10
(B) 7
(C) 8
(D) 3
Answer: Option B is correct.

Explanation:
The students solved the puzzle in 14 or more=6+4=10
The students solved the puzzle in 11 or less=2+1=3
The more students solved the puzzle in 14 or more minutes than solved the puzzle in 11 or less minutes=10-3=7.
Use the dot plot for 13-15.
Question 13.
Jose travels several miles each day for his job. The dot plot shows the distances he traveled for one month. How many days did Jose travel 50, 55, or 60 miles?
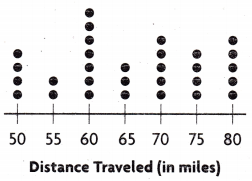
(A) 4
(B) 2
(C) 7
(D) 13
Answer: Option D is correct.

Explanation: Add all the dots present in the 50, 55, 60.
In 50 there are 3 dots
In 55 there are 2 dots
In 60 there are 7 dots.
Therefore, 3+2+7=13.
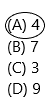
Question 14.
How many more days did Jose travel 70 miles than 65 miles?
(A) 5
(B) 2
(C) 1
(D) 3
Answer: Option B is correct.
![]()
Explanation:
The number of days Jose travel 65 miles=3
The number of days Jose travel 70 miles=5
The number of days Jose travel 70 miles more than 65 miles=5-3=2 days.
Question 15.
Multi-Step How many more days did Jose travel 60 or less miles than he traveled 75 or more miles?
(A) 4
(B) 7
(C) 3
(D) 9
Answer: Option A is correct.
Explanation:
The number of days Jose travel is 60 or less=7+2+4=13.
The number of days Jose travel is 75 or more=5+4=9
The number of more days Jose travel 60 or fewer miles than travelled 75 or more=13-9=4.