Refer to our Texas Go Math Grade 4 Answer Key Pdf to score good marks in the exams. Test yourself by practicing the problems from Texas Go Math Grade 4 Lesson 17.3 Answer Key Dot Plots.
Texas Go Math Grade 4 Lesson 17.3 Answer Key Dot Plots
Essential Question
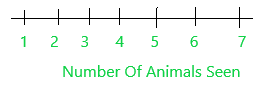
How do you make a dot plot with whole numbers and fractional data?
Answer:
A dot plot is a graphical display of data using dots.
Example: Minutes To Eat Breakfast.
A survey of “How long does it take you to eat breakfast?” has these results:
Minutes: 0 1 2 3 4 5 6 7 8 9 10 11 12
People: 6 2 3 5 2 5 0 0 2 3 7 4 1
This means that 6 people take 0 minutes to eat breakfast (they probably had no breakfast!), 2 people say they only spend one 1-minute having breakfast, etc. And here is the dot plot:

Unlock the Problem
A dot plot is a graph that shows the frequency of data along a number line.
Example 1
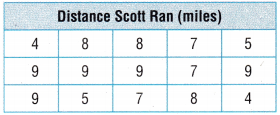
Scott is training to run a half-marathon. He recorded the distances he ran in a table. Use the data in the table to make a dot plot.
STEP 1
Order the data from the least to the greatest distance.
4, 4, _________, _________, _________, _________, _________, _________,
_________, _________, _________, _________, _________, _________, _________
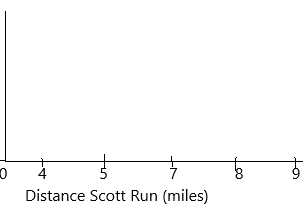
Draw a number line. Label it with the distances. Write a title below the number line to describe the data.
Label the distances on the number line from the least value of the data to the greatest. The data points for this dot plot will be
_________, _________, _________, _________, _________, and _________.
Answer:
Step 1: Order the data from the least to the greatest distance.
4, 4, 5, 5, 7, 7, 7, 8, 8, 8, 9, 9, 9, 9, 9.
Draw a number line. Label it with the distances. Write a title below the number line to describe the data.
1. The title is Distance Scott Run (miles).
2. The distances are 4, 5, 7, 8, 9.
3. Number line
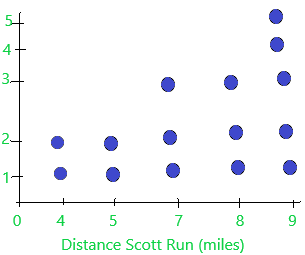
4. The dot points are 2, 2, 3, 3, 5.
STEP 2
To represent the data values, place two dots above the 4 on the number line to show how many times Scott ran that distance.
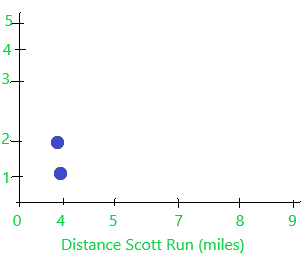
Complete the dot plot by placing the correct number of dots above the distances on the number line.
I’m – 2
Answer: The total distance points representation in below diagram:
Explain why a dot plot is a useful way to organize and present data.
Answer:
A dot plot is similar to a histogram that displays the number of data points that fall into each category or value on the axis. You can use a dot plot to compare your data to a reference group, identity outliers, and see trends.
Example 2
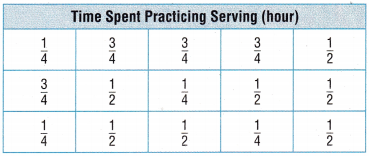
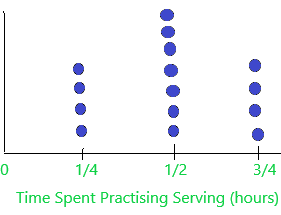
Kristen practices her tennis serve every day. She records the amount of time she practices, in fractions of an hour. Use the data in the table to make a dot plot to represent the data.
STEP 1
Order the data from the least to greatest fractional part of an hour. Draw a number line. Label it with the fractions. Write a title below it to describe the data.
The data points should start with the least fraction and end with the greatest fraction. The data points for this dot plot will be __________, __________, __________.
Answer:
Order the data from the least to the greatest fractional part of an hour.
1/4, 1/2, 3/4.
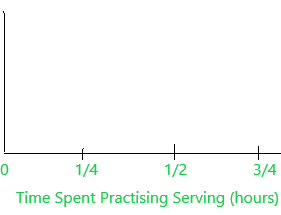
1. The title is Time Spent Practising Serving (hours).
2. Number line:
3. The dot points are 4, 7, 4.
STEP 2
Place a dot above each fraction on the number line to show how many times Kristen spent that time practising her serve.
Answer: The representation has shown below diagram:
Share and Show
Question 1.
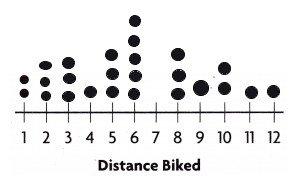
Use the data in the Distance Biked table to complete the dot plot.
Answer:
Step 1: Order the data from the least to the greatest distance.
1, 1, 2, 2, 2, 3, 3, 3, 4, 5, 5, 5, 6, 6, 6, 6, 6, 8, 8, 8, 9, 10, 10, 11, 12.
Draw a number line. Label it with the distances. Write a title below the number line to describe the data.
1. The title is Distance Biked (km).
2. The distances are 1, 2, 3, 4, 5, 6, 8, 9, 10, 11, 12.
3. Number line
4. The dot points are 2, 3, 3, 1, 3, 5, 0, 3, 1, 2, 1, 1.
STEP 2
To represent the data values, place two dots above the 1 on the number line to show how many times the distance biked. Likewise, Complete the dot plot by placing the correct number of dots above the distances on the number line.
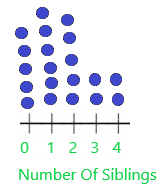
Question 2.
Make a dot plot from the data in the table.
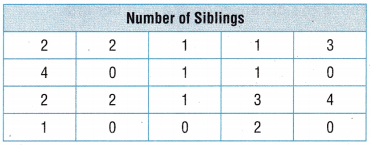
Answer:
Step 1: Order the data from the least to the greatest number.
0, 0, 0, 0, 0, 1, 1, 1, 1, 1, 1, 2, 2, 2, 2, 2, 3, 3, 4, 4.
Draw a number line. Label it with the number. Write a title below the number line to describe the data.
1. The title is Number Of Siblings.
2. The distances are 0, 1, 2, 3, 4
3. Number line
![]()
4. The dot plots are 5, 6, 5, 2, 2.
STEP 2
To represent the data values, place five dots above the 0 on the number line to show how many siblings. Likewise, Complete the dot plot by placing the correct number of dots above the numbers on the number line.
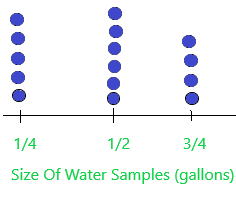
Question 3.
Make a dot plot using the data in the table.
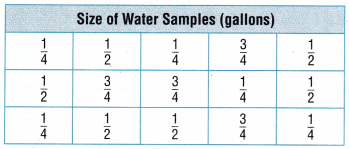
Answer:
STEP 1
Order the data from the least to the greatest fractional part of an hour. Draw a number line. Label it with the fractions. Write a title below it to describe the data.
1. Order the data from the least to the greatest fractional part of an hour.
1/4, 1/4, 1/4, 1/4, 1/4, 1/2, 1/2, 1/2, 1/2, 1/2, 1/2, 3/4, 3/4, 3/4, 3/4.
2. The title is Size Of Water Samples (gallons).
3. Number line:
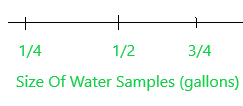
4. The dot plots are 5, 6, 4.
STEP 2
Place a dot above each fraction on the number line to show the size of water samples:
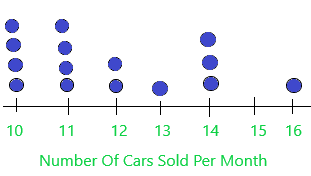
Question 4.
Make a dot plot using the data in the table.
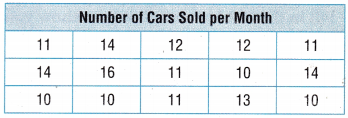
Answer:
Step 1: Order the data from the least to the greatest number.
10, 10, 10, 10, 11, 11, 11, 11, 12, 12, 13, 14, 14, 14, 16.
Draw a number line. Label it with the number. Write a title below the number line to describe the data.
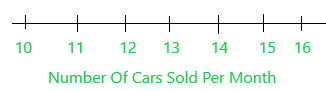
1. The title is Number Of Cars Sold Per Month.
2. The distances are 10,11, 12, 13, 14, 15, 16.
3. Number line:
4. The dot plots are 4, 4, 2, 1, 3, 0, 1.
STEP 2
To represent the data values, place four dots above the 10 on the number line to show how many cars sold. Likewise, Complete the dot plot by placing the correct number of dots above the numbers on the number line.
Problem Solving
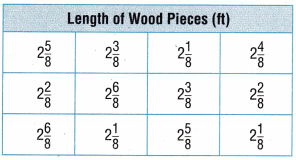
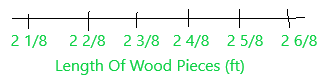
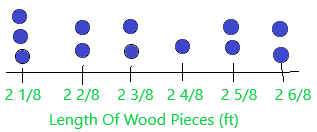
Question 5.
H.O.T. Multi-Step Martin wants to build some tool boxes for his friends. He plans to use wood that he already has. He listed the different lengths of the wood he has in a table. Use this data to create a dot plot so Martin can easily visualize what lengths of wood he has.
Answer:
Step 1: Order the data from the least to the greatest fraction.
2 1/8, 2 1/8, 2 1/8, 2 2/8, 2 2/8, 2 3/8, 2 3/8, 2 4/8, 2 5/8, 2 5/8, 2 6/8, 2 6/8.
Draw a number line. Label it with the fractions. Write a title below the number line to describe the data.
1. The title is Length Of Wood Pieces (ft).
2. Number line:
3. The dot plots are 3, 2, 2, 1, 2, 2.
STEP 2
To represent the data values, place three dots above the 2 1/8 on the number line to show the length of the wood. Likewise, Complete the dot plot by placing the correct number of dots above the fractions on the number line.
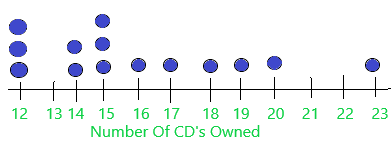
Question 6.
H.O.T. Use Graphs Explain how you would use the data in the table to make a dot plot. Then represent the data in a dot plot.
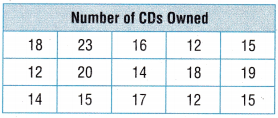
Answer:
Step 1: Order the data from the least to the greatest number.
12, 12, 12, 14, 14, 15, 15, 15, 16, 17, 18, 19, 20, 23.
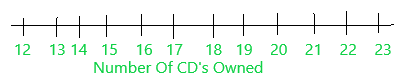
Draw a number line. Label it with the number. Write a title below the number line to describe the data.
1. The title is Number Of CD’s Owned.
2. Number line:
3. The dot plots are 3, 0, 2, 3, 1, 1, 1, 1, 1, 0, 0, 1.
STEP 2
To represent the data values, place three dots above the 12 on the number line to show how many CD’s owned. Likewise, Complete the dot plot by placing the correct number of dots above the numbers on the number line.
Daily Assessment Task
Fill in the bubble completely to show your answer.
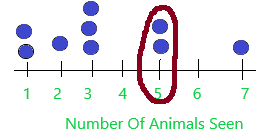
Question 7.
Some of the students in Jose’s class counted the number of animals each of them saw during recess. Jose wants to make a dot plot to represent the data. How many dots will he place above the number 5?
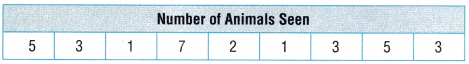
(A) 1
(B) 3
(C) 2
(D) 5
Answer: Option C is correct.
![]()
Explanation:
Step 1: Order the data from the least to the greatest number.
1, 1, 2, 3, 3, 3, 5, 5, 7.
Draw a number line. Label it with the number. Write a title below the number line to describe the data.
1. The title is Number Of Animals Seen.
2. Number line:
3. The dot plots are 2, 1, 3, 0, 2, 0, 1.
STEP 2
To represent the data values, place two dots above the 1 on the number line to show how many animals are seen. Likewise, Complete the dot plot by placing the correct number of dots above the numbers on the number line.
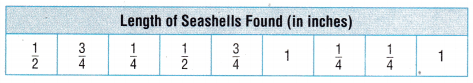
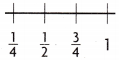
Question 8.
Sara went to the beach for a week. She recorded the length of the shells she found each day in the table below. She wants to make a dot plot to represent the lengths she recorded. Which shows the way Sara should label the fraction lengths on the number line?
(A)
(B)
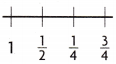
(C)
(D)
Answer: Option A is correct.
Explanation: Order the data from the least to the greatest fraction.
1/4, 1/2, 3/4, 1.
TEXAS Test Prep
Question 9.
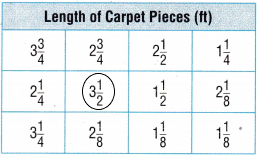
The data in the table shows the lengths of some pieces of carpet that Justin has. He wants to make a dot plot to show the data. How many dots will Justin place above the 3\(\frac{1}{2}\)?
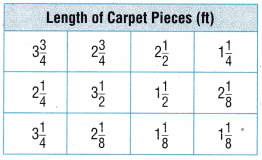
(A) 0
(B) 1
(C) 3
(D) 4
Answer: Option B is correct.

Explanation: Number lines explained in the above questions once check out. Here asked how many 3 1/2 are there. I circled in the below diagram.
Texas Go Math Grade 4 Lesson 17.3 Homework and Practice Answer Key
Question 1.
Make a dot plot using the data in the table.
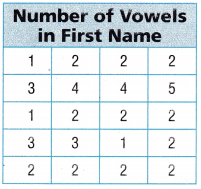
Answer:
Step 1: Order the data from the least to the greatest number.
1, 1, 1, 2, 2, 2, 2, 2, 2, 2, 2, 2, 2, 2, 3, 3, 3, 4, 4, 5.
Draw a number line. Label it with the number. Write a title below the number line to describe the data.
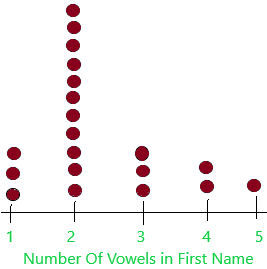
1. The title is Number Of Vowels in First Name.
2. Number line:
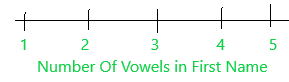
3. The dot plots are 3, 11, 3, 2, 1.
STEP 2
To represent the data values, place three dots above the 1 on the number line to show how many vowels are in the first name. Likewise, Complete the dot plot by placing the correct number of dots above the numbers on the number line.
Question 2.
Make a dot plot using the data in the table.
Answer:
Step 1: Order the data from the least to the greatest number.
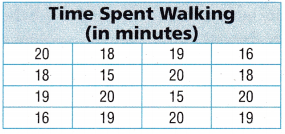
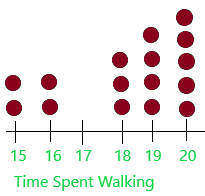
15, 15, 16, 16, 18, 18, 18, 19, 19, 19, 19, 20, 20, 20, 20, 20.
Draw a number line. Label it with the number. Write a title below the number line to describe the data.
1. The title is Time Spent Walking (In Minutes).
2. Number line:
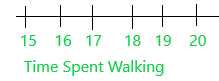
3. The dot points are 2, 2, 0, 3, 4, 5.
STEP 2
To represent the data values, place two dots above the 15 on the number line to show how much was spent on walking. Likewise, Complete the dot plot by placing the correct number of dots above the numbers on the number line.
Problem Solving
Question 3.
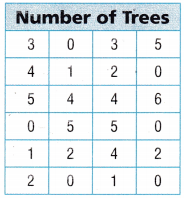
Jerome took a walk through his neighborhood. He recorded the number of trees he saw in each yard. Use the data in the table to make a dot plot to represent the data.
Answer:
Step 1: Order the data from the least to the greatest number.
0, 0, 0, 0, 0, 0, 1, 1, 1, 2, 2, 2, 2, 3, 3, 4, 4, 4, 4, 5, 5, 5, 5.
Draw a number line. Label it with the number. Write a title below the number line to describe the data.
1. The title is Number Of Vowels in First Name.
2. Number line:
3. The dot plots are 6, 3, 4, 2, 4, 4.
STEP 2
To represent the data values, place six dots above the 0 on the number line to show how many trees. Likewise, Complete the dot plot by placing the correct number of dots above the numbers on the number line.
Question 4.
Tiffany recorded the amount of time it took her to walk to school each day. Use the data in the table to make a dot plot to represent the data.
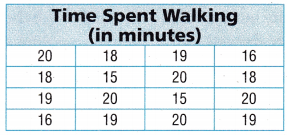
Answer:
Step 1: Order the data from the least to the greatest number.
15, 15, 16, 16, 18, 18, 18, 19, 19, 19, 19, 20, 20, 20, 20, 20.
Draw a number line. Label it with the number. Write a title below the number line to describe the data.
1. The title is Time Spent Walking (In Minutes).
2. Number line:
3. The dot points are 2, 2, 0, 3, 4, 5.
STEP 2
To represent the data values, place two dots above the 15 on the number line to show how much was spent on walking. Likewise, Complete the dot plot by placing the correct number of dots above the numbers on the number line.
Lesson Check
Fill in the bubble completely to show your answer.
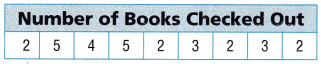
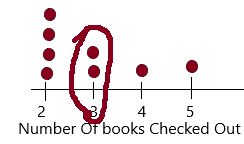
Question 5.
Mrs. Thompson counted the number of books that students in her class checked out from the library. She wants to make a dot plot to represent the data. How many dots will she place above the number 3?
(A) 6
(B) 3
(C) 9
(D) 2
Answer: Option D is correct.

Explanation: Step 1: Order the data from the least to the greatest number.
2, 2, 2, 2, 3, 3, 4, 5..
Draw a number line. Label it with the number. Write a title below the number line to describe the data.
1. The title is Number Of Books Checked Out.
Step 2: The total representation is shown below diagram:
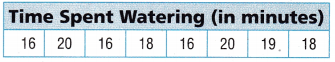
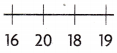
Question 6.
Hector recorded the time he spent watering his yard each day. He wants to make a dot plot to represent the times he recorded. Which shows the way Hector should label the times on the number line?
(A)
(B)
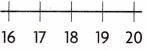
(C)
(D)
Answer: Option B is correct.
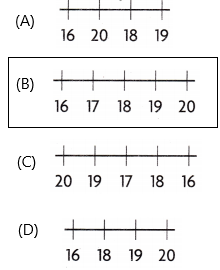
Explanation: Step 1: Order the data from the least to the greatest number.
16, 16, 16, 18, 18, 19, 20, 20.
Draw a number line. Label it with the number. Write a title below the number line to describe the data.
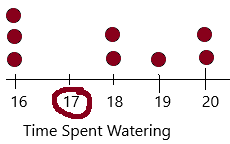
We need to represent 17 in the number line.
Use the table at right for 7-8.
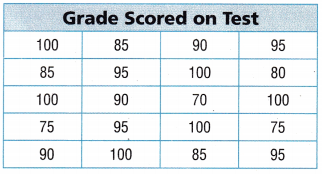
Question 7.
Multi-Step Mr. Davis recorded the grades his students scored on a math test. He wants to make a dot plot to represent the data. How many more dots will he place above the 100 than above the 70, 75, and 80 combined?
(A) 2
(B) 6
(C) 3
(D) 4
Answer: Option A is correct.

Step 1: Order the data from the least to the greatest number.
70, 75, 75, 80, 85, 85, 85, 90, 90, 90, 95, 95, 95, 95, 100, 100, 100, 100, 100, 100.
Draw a number line. Label it with the number. Write a title below the number line to describe the data.
1. The title is Grade Scored On Test.
The 100’s are 6.
70,75, 80 totally combined :1+2+1=4.
many more dots will be placed above the 100 than above the 70, 75, and 80 combined=6-4=2.
Question 8.
Multi-Step Which statement about the dot plot is NOT true?
(A) Fewer students scored 90 than 95.
(B) More students scored 75 than 80.
(C) More students scored 95 than 80 and 85 combined.
(D) The same number of students scored 85 and 90.
Answer: Option C is correct.
Explanation: Check all the options. Compare everything. Then we get answer.