Refer to our Texas Go Math Grade 3 Answer Key Pdf to score good marks in the exams. Test yourself by practicing the problems from Texas Go Math Grade 3 Unit 5 Answer Key Data Analysis.
Texas Go Math Grade 3 Unit 5 Answer Key Data Analysis
Show What You Know
Check your understanding of important skills.
Skip Count: Skip count to find the missing numbers.
Question 1.
Count by twos. 2, 4, ______, _______, 10, _______, ________, 16
Answer: 2,4,6,8,10,12,16
Explanation:
Multiples of 2 are 2,4,6,8,10,12,16
Question 2.
Count by fives. 5, 10, ______, _______, ____ , 30, ______
Answer: 5,10,15,20,25,30,35
Explanation:
Multiples of 5 are 5,10,15,20,25,30,35
Read a Pictograph For 3, use the pictograph.
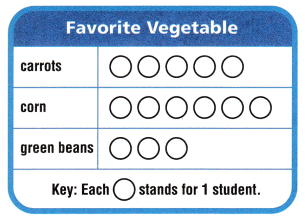
Question 3.
Which vegetable did the most students choose? __________
Answer: Corn
Explanation:
With the help of bar graph we can say that most of the students opted for Corn
Read a Bar Graph: For 4-5, use the bar graph.
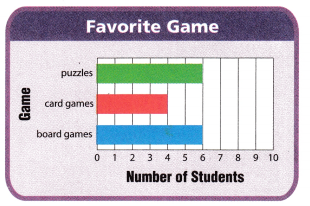
Question 4.
How many students chose puzzles? __________ students
Answer: 6
Explanation:
With the help of bar graph we can say that 6 students have chosen puzzles
Question 5.
How many students answered the question? __________ students
Answer: 16 students
Explanation:
With the help of bar graph we can say that 16 students have answered the questions
Vocabulary Builder
Visualize It
Complete the bubble map by using the words with a ✓.
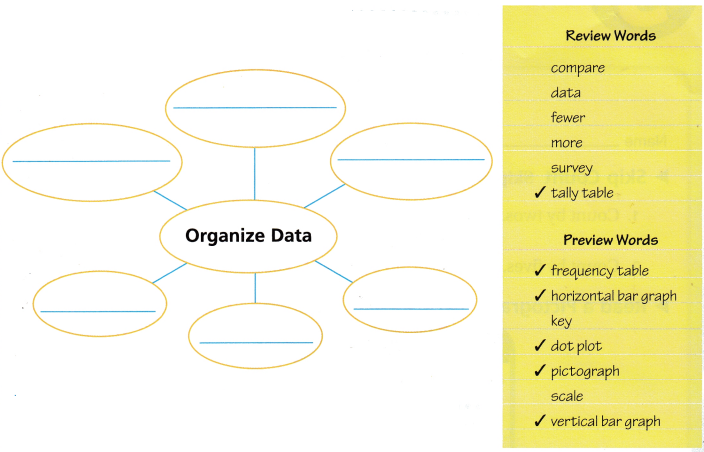
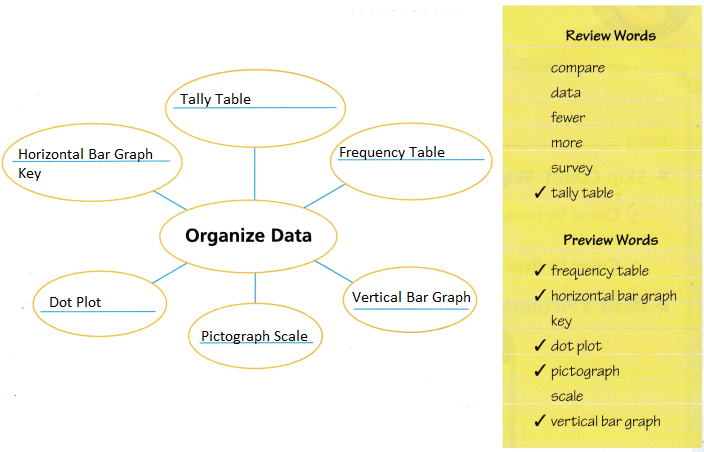
Explanation:
Bubble map is completed with review words and preview words
Understand Vocabulary
Write the preview word that answers the riddle.
Question 1.
I am a graph that records each piece of data above a number line. ____________
Answer: line plot
Explanation:
A graph that records each piece of data on a number line.
Question 2.
I am the numbers that are placed at fixed distances on a graph to help label the graph. __________
Answer: Scale
Explanation:
The numbers placed at fixed distances on a graph to help label the graph.
Question 3.
I am the part of a map or graph that explains the symbols. _____________
Answer: Key Graph
The part of a map or graph that explains the symbols.
Question 4.
I am a graph that uses pictures to show and compare the information. ___________
Answer: Pictograph
Explanation:
A graph that uses pictures to show and compare information.
Question 5.
I am a table that uses numbers to record data. _____________
Answer: Frequency table
Explanation:
A table that uses numbers to record
Reading & Writing Math
Vocabulary
To organize and display information, you can use a bar graph or a pictograph.
The teachers at Park Elementary surveyed their students to find out how much time they spent on homework. The bar graph shows their data. Use the bar graph to complete the pictograph.
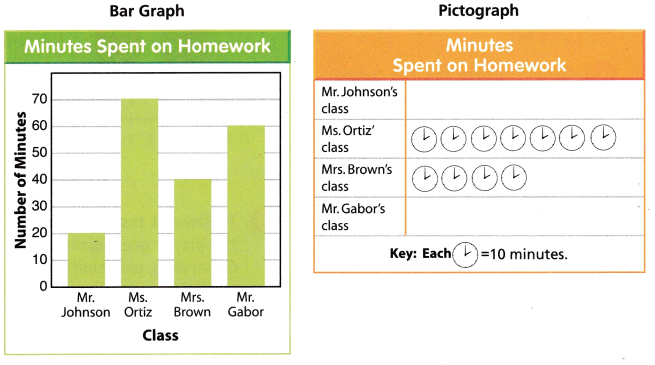
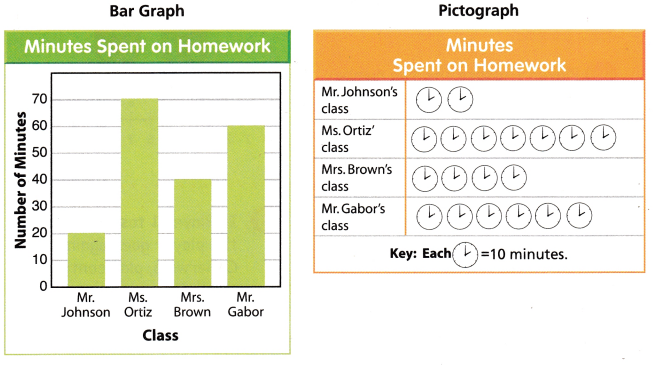
Explanation:
Pictograph was completed.
Writing Survey 5 students about how much time they spent doing homework last night. You can use this information to make a bar graph or a pictograph.

Reading Look for this book in the library. Tiger Math: Learning to Graph From a Baby Tiger, by Ann Whitehead Nagda and Cindy Bickel.
Answer:
Get Ready Game
Dot Plot Sums
Object of the Game Make a dot plot of the sums you roll.
Materials
- 2 number cubes labeled 1-6
- number lines labeled 2-12
- pencil or marker
Set Up
Each player gets one number line.
Number of Players 2, 3, or 4
How to Play
1. Player 1 tosses the two number cubes. The sum of the numbers tossed is a data value on the dot plot.
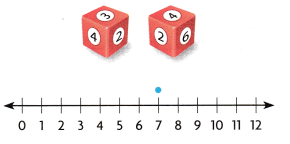
2. Player 1 draws a dot above the number line for the sum.
3. If Player 1 tosses doubles, the player goes again. Otherwise, play continues clockwise.
4. The first player who has five dots above the same sum wins the game.
Answer: This is a number game to learn about the number line