Refer to our Texas Go Math Grade 3 Answer Key Pdf to score good marks in the exams. Test yourself by practicing the problems from Texas Go Math Grade 3 Lesson 19.4 Answer Key Solve Problems with Bar Graphs.
Texas Go Math Grade 3 Lesson 19.4 Answer Key Solve Problems with Bar Graphs
Unlock the Problem
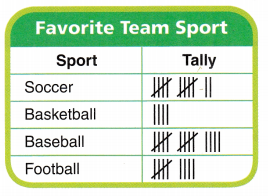
Jordan took a survey of his classmates to find out their favorite team sports. He recorded the results in the table at the right. How can he show the results in a bar graph?
Make a bar graph.
STEP 1:
Write a title at the top to tell what the graph is about. Label the side of the graph to tell about the bars. Label the bottom of the graph to explain what the numbers tell.
STEP 2:
Choose numbers for the bottom of the graph so that most of the bars will end on a line. Since the least number is 4 and the greatest number is 14, make the scale 0-16. Mark the scale by twos.
STEP 3:
Draw and shade a bar to show the number for each sport.
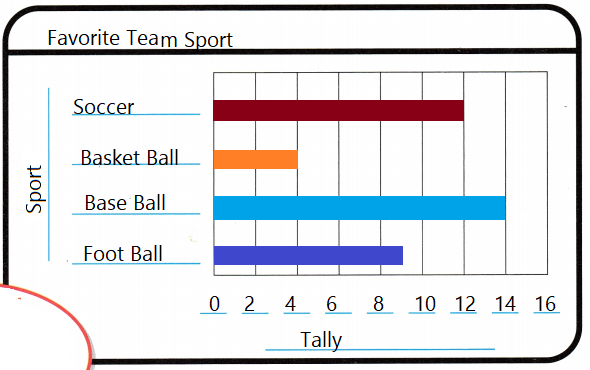
Answer:
Explanation:
Bar graph is done according to the steps
Math Talk
Mathematical Processes
How did you know how long to draw the bar for football?
Answer: 9
Explanation:
As the number is nine so we have to draw till the middle of 8 and 10
Share and Show
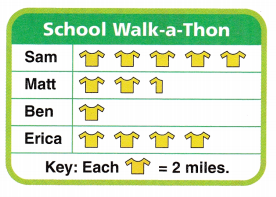
Matt’s school is having a walk-a-thon to raise money for the school library. Matt made a pictograph to show the number of miles some students walked. Make a bar graph of Matt’s data. Use a scale of 0 – ________, and mark the scale by _________.

Explanation:
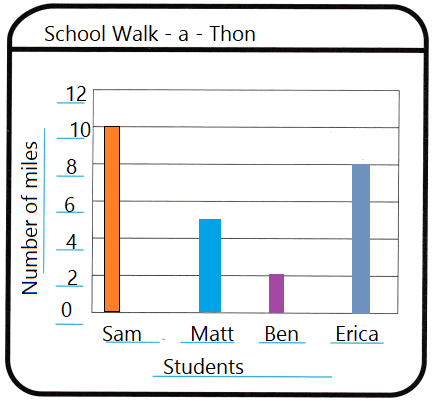
Use a scale of 0 – 12, and mark the scale by 2.
Use your bar graph for 1-4.
Question 1.
Which student walked the most miles?
Answer: Sam
Explanation:
Sam walked the most miles that is10 miles
Question 2.
How many more miles would Matt have had to walk to equal the number of miles Erica walked?
Answer: 3 miles
Explanation:
3 more miles would Matt have had to walk to equal the number of miles Erica walked
8 – 5 = 3
Question 3.
How many miles in all did the students walk?
Answer: 25 miles
Explanation:
25 miles in all the students walk
Question 4.
Write the number of miles the students walked in order from greatest to least.
Answer:
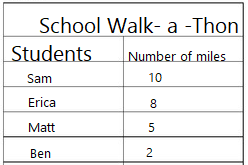
Explanation:
A Frequency table is made the number of miles the students walked in order from greatest to least.
Math Talk
Mathematical Processes
Explain how the graph would change if another student, Daniel, walked double the number of smiles Erica walked.
Answer: Erica walked 8
Explanation:
Another student, Daniel, walked double the number of smiles Erica walked
so, The graph bar stops at 16
Problem Solving
Question 5.
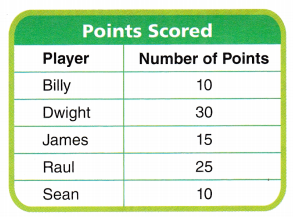
Use Tools Susie recorded the number of points some basketball players scored. Use the data in the table to make a bar graph. Choose numbers so that most of the bars will end on a line.
Answer:
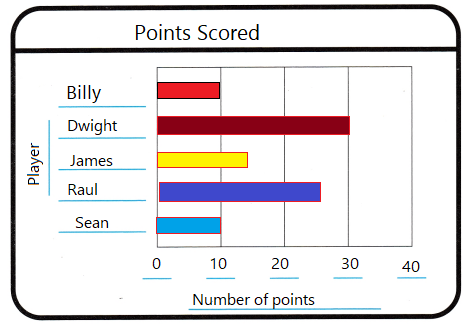
Explanation:
Completed the bar graph
Use your bar graph for 6-9.
Question 6.
Analyze Which player scored the most points?
Answer: Dwight and Raul
Explanation:
Dwight scored 30 and Raul scored 25
Question 7.
H.O.T. Pose a Problem Write and solve a new problem that matches the data in your bar graph.
Answer: How much Dwight scored than Billy?
Explanation:
Number of points scored by Dwight is 30
And Number of points scored by Billy is 10
30 – 10 = 20
Dwight scored more 20 than Billy
Question 8.
Analyze Which player scored 10 fewer points than Raul?
Answer: James
Explanation:
player James scored 10 fewer points than Raul
as Raul scored 25 and James scored 15
Question 9.
H.O.T. Multi-Step What if James scored 5 more points? How many points in all did the five players score?
Answer: 95
Explanation:
James scored 15 + 5 = 20
Dwight = 30
Raul = 25
Billy = 10
Sean 10
so, total = 95
Daily Assessment Task
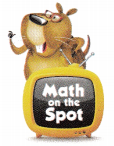
Fill in the bubble for the correct answer choice. Use the Farm Animals on Nate’s Farm bar graph for 10-13.
Question 10.
Nate made this bar graph of the farm animals on his farm. How many horses does Nate have?
(A) 4
(B) 3
(C) 2
(D) 5
Answer: B
Explanation:
According to bar graph
Nate made this bar graph of the farm animals on his farm. Nate have 3 horses
Question 11.
Apply Nate is planning to get some turkeys. At what number on the scale would a bar for turkeys end if Nate wants to have the same number of turkeys as chickens?
(A) 11
(B) 12
(C) 9
(D) 10
Answer: 11
Explanation:
According to bar graph
Apply Nate is planning to get some turkeys.
At number 11 on the scale would a bar for turkeys end if Nate wants to have the same number of turkeys as chickens
Question 12.
Multi-Step The total number of horses and pigs Nate has is equal to the number of which other kind of animal?
(A) chickens
(B) sheep
(C) cows
(D) horses
Answer: C
Explanation:
According to bar graph
The total number of horses and pigs Nate has is equal to the number of cows
Texas Test Prep
Question 13.
Multi-Step How many farm animals in all are on Nate’s farm?
(A) 21
(B) 12
(C) 17
(D) 27
Answer: 27
Explanation:
According to bar graph
27 farm animals in all are on Nate’s farm
Texas Go Math Grade 3 Lesson 19.4 Homework and Practice Answer Key
Problem Solving
Question 1.
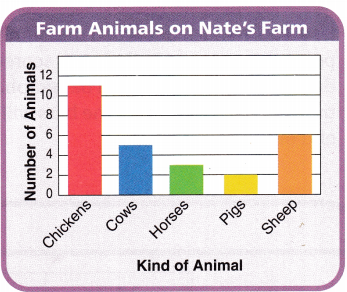
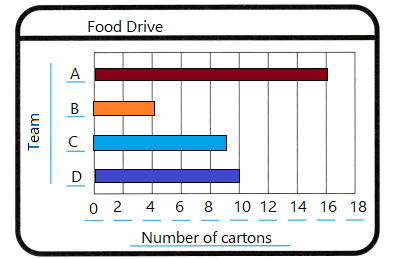
A scout troop collected cartons of food for a food drive. They recorded the number of cartons each team collected. Use the data in the tally table to make a bar graph. Choose numbers so that most bars will end on a line.
Answer:
Use your bar graph for 2-5.
Question 2.
Which team collected the most cartons of food?
Answer: Team A
Explanation:
According to bar graph
team A collected the most cartons of food that is 16
Question 3.
How many cartons of food did all of the teams collect?
Answer: 41
Explanation:
According to bar graph
All of the teams collect 41 cartons of food
Question 4.
How many more cartons of food must team C collect to equal the number of cartons that Team A collected?
Answer: 7
Explanation:
According to bar graph
team A collected the most cartons of food that is 16
team C collected 9
16 – 9 = 7 more cartons of food must team C collect to equal the number of cartons that Team A collected
Question 5.
Which two other teams combined collected the same number of cartons that Team A collected?
Answer: No
Explanation:
According to bar graph
No, two other teams combined collected the same number of cartons that Team A collected
Lesson Check
Fill in the bubble completely to show your answer. Use the Runs Scored bar graph for 6-8.
Question 6.
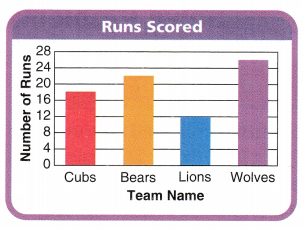
Morris made this bar graph of the number of runs scored by teams in a softball league. How many more runs did the Wolves score than the Cubs?
(A) 18
(B) 44
(C) 8
(D) 26
Answer: C
Explanation:
According to bar graph
Wolves score = 25
Cubs score = 17
Morris made this bar graph of the number of runs scored by teams in a softball league.
8 more runs did the Wolves score than the Cubs
Question 7.
How many runs will the bar for Lions show if the Lions score 7 more runs?
(A) 19
(B) 7
(C) 12
(D) 18
Answer: A
Explanation:
According to bar graph
19 runs the bar for Lions show if the Lions score 7 more runs
Question 8.
Multi-Step How many fewer runs did the Bears score than the Cubs and Lions combined?
(A) 18
(B) 23
(C) 12
(D) 8
Answer: D
Explanation:
According to bar graph
Bears score =21
Cubs and Lions combined 17 + 12 = 29
29 – 21 = 8
8 fewer runs the Bears score than the Cubs and Lions combined.
Use the School Supplies bar graph for 9-11.
Question 9.
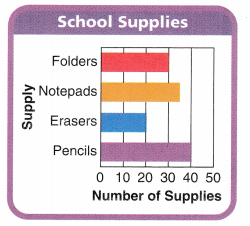
Mrs. Susi makes this bar graph of supplies for her classroom. If she has 24 students, how many notepads will she have left?
(A) 35
(B) 10
(C) 30
(D) 11
Answer: D
Explanation:
According to bar graph
Mrs. Susi makes this bar graph of supplies for her classroom.
35 – 24 =11
If she has 24 students,
11 Notepads will be left
Question 10.
Mrs. Susi’s class of 24 students is divided into 4 equal groups. How many pencils will each group get if the pencils are divided equally among the groups?
(A) 10
(B) 12
(C) 8
(D) 40
Answer: A
Explanation:
According to bar graph
Mrs. Susi’s class of 24 students is divided into 4 equal groups.
10 pencils will each group get if the pencils are divided equally among the groups
4 groups x 10 = 40 pencils
Question 11.
Multi-Step Mrs. Susi wants to have 40 more pencils than erasers. How many more pencils does she need to buy?
(A) 10
(B) 30
(C) 20
(D) 60
Answer: C
Explanation:
According to bar graph
Susi has 20 erasers
Mrs. Susi wants to have 40 more pencils than erasers
40 + 20 = 60
Susi has 40 pencils before so she need 20 pencils
60 – 40 = 20