Refer to our Texas Go Math Grade 2 Answer Key Pdf to score good marks in the exams. Test yourself by practicing the problems from Texas Go Math Grade 2 Lesson 19.3 Answer Key Read Bar Graphs.
Texas Go Math Grade 2 Lesson 19.3 Answer Key Read Bar Graphs
Essential Question
How is a bar graph used to show data?
Draw or write to show what you did.
___ red trucks
For The Teacher
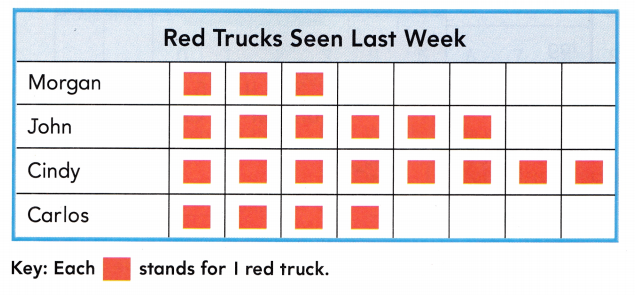
- Read this problem to children. Morgan made a pictograph to show the number of red trucks that she and her friends saw last week. How many red trucks did the four children see last week?
Answer:
Bar graphs are ideal for comparing two or more values, or values over time. Data is displayed either horizontally or vertically.
3 + 6 + 8 + 4 = 21
The four children seen 21 red trucks last week.
Explanation:
Morgan seen 3 red Trucks, John seen 6 red Trucks, Cindy seen 8 red trucks, and Carlos seen 4 red trucks in last week this data we can observe in the above bar graph. Add all the red trucks. Add 3 with 6, 8 and 4 the sum is 21. Morgan and her friends saw 21 red trucks last week.
Math Talk
Mathematical Processes
Describe how the data in the graph for John and for Cindy different.
Answer:
In the above image we can observe a bar graph named Red trucks seen last week. The data in the graph for John and Cindy are different. John seen 6 red Trucks, and Cindy seen 8 red trucks.
Model and Draw
A bar graph uses bars to show data. Look at where the bars end. The numbers of the scale tell how many.
Answer:
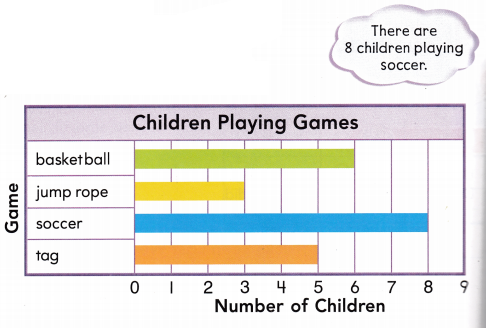
In the above bar graph we can observe 6 children playing basket ball, 3 children playing jump rope, 8 children playing soccer, and 5 children playing tag.
Share and Shows
Use the bar graph.
Question 1.
How many green marbles are in the bag?
____ green marbles
Answer:
Answer:
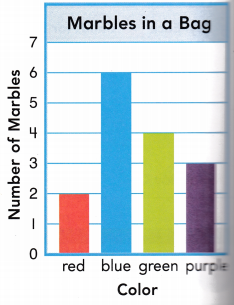
There are 4 green marbles in the bag.
Explanation:
In the above bar graph we can observe color and number marbles in a bag. There are 4 green marbles in the bag.
Question 2.
How many more blue marbles than purple marbles are in the bag?
______ more blue marbles
Answer:
There are 6 blue marbles and 3 purple marbles in the bag.
6 – 3 = 3
3 more blue marbles.
Explanation:
In the above image we can observe a bar graph named Marbles in a bag. There are 6 blue marbles and 3 purple marbles in the bag. Subtract 3 purple marbles from 6 blue marbles the difference is 3 marbles. There are 3 more blue marbles than purple marbles in the bag.
Question 3.
How many marbles are in the bag?
____ marbles
Answer:
2 + 6 + 4 + 3 = 15
Total number marbles in the bag are 15.
Explanation:
In the above image we can observe a bar graph named Marbles in a bag. There are 2 red marbles, 6 blue marbles, 4 green marbles, and 3 purple marbles in the bag. Add all the marbles in the bag. There are 15 marbles in the bag.
Problem Solving
Use the bar graph.
Question 4.
How many children chose the beach?
_____ children
Answer:
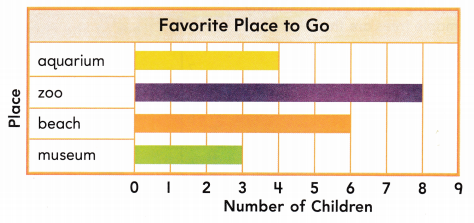
6 children chosen the beach.
Explanation:
In the above image we can observe a bar graph named with Favorite place to Go. In that graph 6 children chosen the beach place.
Question 5.
Which place did the fewest children choose?
Answer:
The fewest children choose the Museum place.
Explanation:
In the above image we can observe a bar graph named with Favorite place to Go. In that graph 4 children choose the aquarium place, 8 children choose the zoo place, 6 children choose the beach place, and 3 children choose the museum place. The fewest children choose the Museum place.
Question 6.
H.O.T. Multi-step Greg chose a place that has more votes than the aquarium and the museum together. Which place did Greg choose?

Answer:

4 + 3 = 7
7 children choose the aquarium and the museum together.
8 children choose the zoo place.
7 < 8
Greg choose zoo place that has more votes than the aquarium and the museum together.
Explanation:
In the above image we can observe a bar graph named with Favorite place to Go. In that graph 4 children choose the aquarium place, 8 children choose the zoo place, and 3 children choose the museum place. First add 4 with 3 the sum is 7. There are 7 children choose the aquarium and the museum together. Greg choose zoo place that has more votes than the aquarium and the museum together.
Question 7.
H.O.T. Multi-Step Gina used the data in the bar graph to write 10 < 11. What votes did she compare?
Answer:
The children voted for museum or zoo are 10. The children voted for aquarium or beach are 11. She compared the total number of votes of who voted for either museum or zoo and either aquarium or beach. Gina used the above bar graph data to write 10 < 11.
Daily Assessment Task
Choose the correct answer.
Question 8.
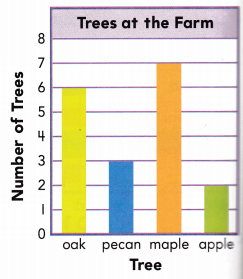
Use the bar graph. How many maple trees are there?
(A) 3
(B) 7
(C) 2
Answer:

Option B is correct.
Explanation:
In the above image we can observe a bar graph named with Trees at the farm. There are 7 maple trees at the farm. So, draw a circle for option B.
Question 9.
Analyze Use the bar graph. How many fewer apple trees than oak trees are there?
(A) 4
(B) 1
(C) 5
Answer:

6 – 2 = 4
There are 4 fewer apple trees than oak trees.
So, option A is correct.
Explanation:
In the above image we can observe a bar graph named with Trees at the farm. Subtract 2 apple trees from 6 oak trees the difference is 4. There are 4 fewer apple trees than oak trees. So, draw a circle for option A.
Question 10.
Multi-Step Use the bar graph. How many trees are not apple trees?
(A) 2
(B) 16
(C) 9
Answer:

6 + 3 + 7 = 16
16 trees are not apple trees.
So, option B is correct.
Explanation:
In the above image we can observe a bar graph named with Trees at the farm. There are 6 oak trees, 3 pecan trees, 7 maple trees and 2 apple trees. Add 6 with 3 and 7 the sum is 16. There are 16 trees that are not apple trees. So, draw a circle for option B.
Question 11.
Texas Test Prep Use the bar graph above. How many oak trees are at the farm?
(A) 6
(B) 3
(C) 8
Answer:

There are 6 oak trees at the farm.
So, option A is correct.
Explanation:
In the above image we can observe a bar graph named with Trees at the farm. There are 6 oak trees at the farm. So, draw a circle for option A.
Take Home Activity
- Ask your child to explain how he or she solved one of the exercises in this lesson.
Texas Go Math Grade 2 Lesson 19.3 Homework and Practice Answer Key
Read Bar Graphs
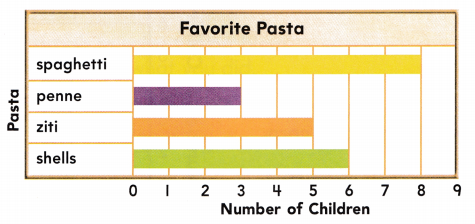
Use the graph.
Question 1.
How many children chose shells?
___ children
Answer:
6 children chose shells.
Explanation:
In the above image we can observe a bar graph named with Favorite Pasta. 6 children chose shells.
Question 2.
What pasta did the fewest children choose?
_______
Answer:
Fewest children have chosen Penne.
Explanation:
In the above image we can observe a bar graph named with Favorite Pasta. 8 children choose spaghetti, 3 children chose penne, 5 children choose ziti, 6 children choose shells. Fewest children have chosen penne.
Problem Solving
Use the bar graph above.
Question 3.
Donna chose a pasta that more children chose than shells. What pasta did Donna choose?
________
Answer:
Donna choose spaghetti.
Explanation:
In the above image we can observe a bar graph named with Favorite Pasta. 8 children choose spaghetti, 3 children chose penne, 5 children choose ziti, 6 children choose shells. Donna chose spaghetti pasta because it was chosen by more children than shells.
Question 4.
Multi-Step Bart used the data in the bar graph to write 13 > 9. What votes did he compare?
Answer:
The children voted for spaghetti or ziti are 13. The children voted for penne or shells are 9. She compared the total number of votes of who voted for either spaghetti or ziti and either penne or shells. Bart used the above bar graph data to write 13 > 9.
Texas Test Prep
Lesson Check
Choose the correct answer.
Question 5.
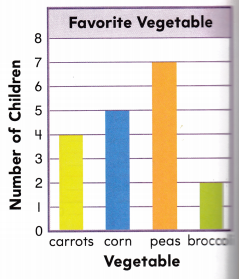
How many children chose broccoli?
(A) 5
(B) 2
(C) 4
Answer:
Question 6.
How many children chose corn or peas?
(A) 12
(B) 9
(C) 18
Answer:

12 children chose corn or peas.
So, option A is correct.
Explanation:
In the above image we can observe a bar graph named with Favorite vegetables. 12 children chose corn or peas. So, draw a circle for option A.
Question 7.
How many fewer children chose carrots than peas?
(A) 4
(B) 2
(C) 3
Answer:

7 – 4 = 3
3 fewer children chose carrots than peas.
So, option c is correct.
Explanation:
In the above image we can observe a bar graph named with Favorite vegetables. Subtract 4 from 7 the difference is 3. 3 fewer children chose carrots than peas. So, draw a circle for option C.
Question 8.
Multi-Step How many fewer children like carrots or broccoli than corn or peas?
(A) 7
(B) 5
(C) 6
Answer:

4 + 2 = 6
5 + 7 = 12
12 – 6 = 6
6 fewer children like carrots or broccoli than corn or peas.
So, option C is correct.
Explanation:
In the above image we can observe a bar graph named with Favorite vegetables. 6 children like carrots or broccoli. 12 children like corn or peas. Subtract 6 children from 12 children the difference is 6. 6 fewer children like carrots or broccoli than corn or peas. So, draw a circle for option C.