Refer to our Texas Go Math Grade 2 Answer Key Pdf to score good marks in the exams. Test yourself by practicing the problems from Texas Go Math Grade 2 Lesson 19.1 Answer Key Read Pictographs.
Texas Go Math Grade 2 Lesson 19.1 Answer Key Read Pictographs
Essential Question
How do you use a pictograph to show data?
Explanation:
Pictograms use a series of repeated icons to visualize simple data.
The icons are arranged in a single line or a grid,
with each icon representing a certain number of units
Explore
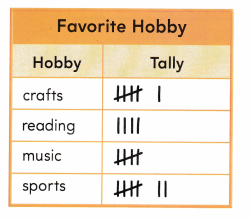
Use the tally chart to solve the problem. Draw or write to show what you did.
__ more children
Explanation:
7 – 4 = 3
3 more children
Math Talk
Mathematical processes
Can the chart be used to find how many girls chose music? Explain.
Explanation:
Yes, The chart is used to find how many girls chose music
1 line represent one girl
so, 5 girls chose music
For The Teacher
- Read the following problem. Mr. Martin’s class made this tally chart. How many more children in his class chose sports ? Explain. than chose reading as their favorite hobby?
Explanation:
4 chose reading
7 chose sports
7 – 4 = 3 more children in his class chose sports than chose reading as their favorite hobby
Model and Draw
A pictograph uses pictures to show data.
A key tells how many each picture stands for.

Share and Show
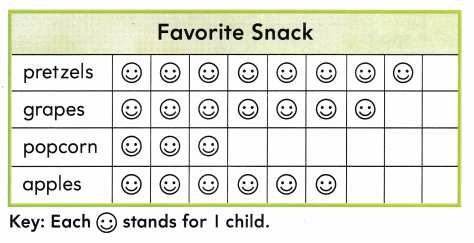
Use the pictograph to answer the questions.
Question 1.
Which snack was chosen by the fewest children?
Answer: popcorn
Explanation:
popcorn snack was chosen by the fewest children
Question 2.
How many more children chose pretzels than apples? _________ more children
Answer: 2 more children
Explanation:
Number of children chose pretzels = 8
Number of children chose apples = 6
8 – 6 = 2
Problem Solving
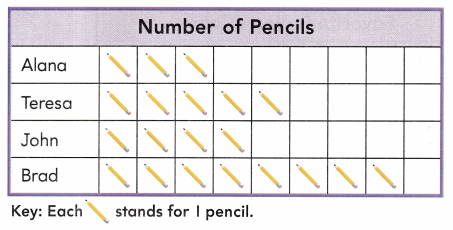
Use the pictograph to answer the questions.
Question 3.
How many pencils do Alana and Brad have?
__ pencils
Answer: 11 pencils
Explanation:
Number of pencils Alana had = 3
Number of pencils Brad had = 8
8 + 3 = 11
Question 4.
How many more pencils does Teresa have than Alana has?
______ more pencils
Answer: 2 more pencils
Explanation:
Number of pencils Alana had = 3
Number of pencils Teresa have = 5
5 – 3 = 2
Question 5.
Multi-Step Mrs. Green has the same number of pencils as the four children. How many pencils does she have?
________ pencils
Answer:
Number of pencils Alana = 3
and Number of pencils Brad = 8
Number of pencils Teresa = 5
Number of pencils John = 4
All 4 = 20
so, Mrs. Green have 20 pencils.
Question 6.
H.O.T. Christy has 7 pencils. Write two sentences to describe how her number of pencils compares to the data in the pictograph.
Answer:
Christy has 7 pencils.
Explanation:
The total students have 20 pencils
Bred has 8 and Christy has 7
Christy had 1 less than Bred
Daily Assessment Task
Choose the correct answer.
Question 7.
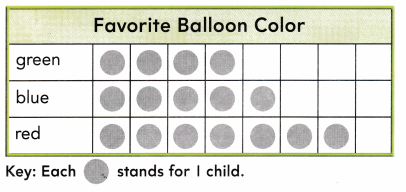
Use Graphs Look at the pictograph above. How many children chose red balloons?
(A) 7
(B) 5
(C) 6
Answer: A
Explanation:
7 children chose red balloons.
Question 8.
Representations Use the pictograph above. How many children voted in all?
(A) 11
(B) 16
(C) 12
Answer: B
Explanation:
16 children voted in all
Question 9.
Texas Test Prep Use the pictograph. How many pets do the three children have?
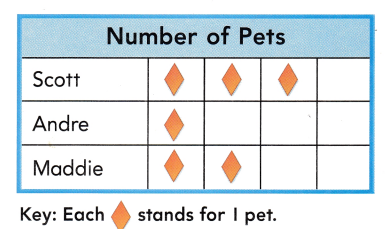
(A) 6
(B) 3
(C) 5
Answer: A
Explanation:
All the three children have 6 pets
Texas Go Math Grade 2 Lesson 19.1 Homework and Practice Answer Key
Use the pictograph to answer the questions.
Question 1.
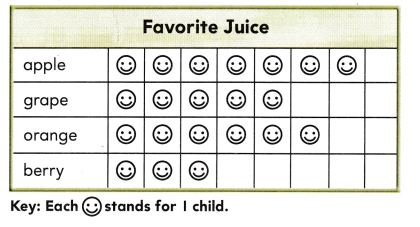
Which juice was chosen by the fewest children?
________
Answer:
Berry Juice was chosen by the fewest people.
Explanation:
In the above image we can observe a pictograph named with Favorite Juice. In that graph we can observe berry juice was chosen by the fewest people.
Question 2.
How many children chose apple juice or orange juice?
____ children
Answer:
7 children chose apple juice.
6 children chose orange juice.
7 + 6 = 13
13 children chose apple juice or orange juice.
Explanation:
In the above image we can observe a pictograph named with Favorite Juice. In that pictograph 7 children chose apple juice and 6 children chose orange juice. Add 7 children with 6 children the sum is 13 children. So, 13 children chose apple juice or orange juice.
Question 3.
How many more children chose apple juice than grape juice?
_____ more children
Answer:
7 children chose apple juice.
5 children chose grape juice.
7 – 5 = 2
2 more children chose apple juice than grape juice.
Explanation:
In the above image we can observe a pictograph named with Favorite Juice. In that pictograph 7 children chose apple juice and 5 children chose grape juice. Subtract 5 children from 7 children the difference is 2 children. So, 2 more children chose apple juice than grape juice.
Problem Solving
Question 4.
Multi-Step Hal likes the juice chosen by 5 children. Martha likes the most favorite juice. Which juices did Hal and Martha choose?
Hal: _____
Martha: _____
Answer:
Hal choose grape juice.
Martha choose apple juice.
Explanation:
In the above image we can observe a pictograph named with Favorite Juice. Grape juice is chosen by 5 children. So, Hal choose grape juice. Apple juice is chosen by 7 children. The most favorite juice for children is apple juice. So, Martha choose apple juice.
Lesson Check
Texas Test Prep
Choose the correct answer.
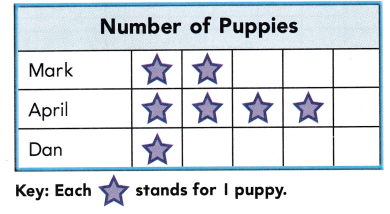
Question 5.
Use the pictograph. How many puppies do Mark and Dan have?
(A) 7
(B) 3
(C) 6
Answer:

Mark have 2 puppies
Dan have 1 puppy.
2 + 1 = 3
So, option B is correct.
Explanation:
In the above image we can observe a pictograph named with Number of puppies. Mark have 2 puppies and Dan have 1 puppy. Add 2 with 1 the sum is 3. Mark and Dan have 3 puppies. So, draw a circle for option B.
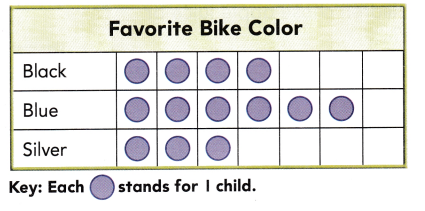
Question 6.
Use the pictograph. How many children chose black?
(A) 4
(B) 6
(C) 3
Answer:

4 children choose black.
So, option A is correct.
Explanation:
In the above image we can observe a pictograph named with Favorite Bike color. Black color is chosen by 4 children. So, draw a circle for option A.
Question 7.
Use the pictograph above. How many children chose black or silver?
(A) 6
(B) 4
(C) 7
Answer:

4 children chose black color.
3 children chose silver color
4 + 3 = 7
7 children chose black or silver color.
So, option C is correct.
Explanation:
In the above image we can observe a pictograph named with Favorite Bike color. Black color is chosen by 4 children and silver color is chosen by 3 children. Add 4 children with 3 children the sum is 7 children. Black or silver color is chosen by 7 children. So, draw a circle for option C.