Practice questions available in McGraw Hill Math Grade 6 Answer Key PDF Lesson 24.2 Line Graphs will engage students and is a great way of informal assessment.
McGraw-Hill Math Grade 6 Answer Key Lesson 24.2 Line Graphs
Exercises
INTERPRET
Question 1.
Between what two years did the number of dolphin sightings increase the most?
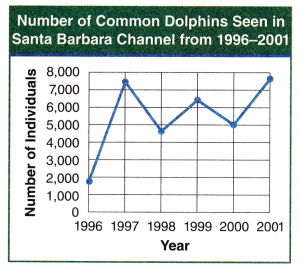
Answer:
From the above line graph, we can say that in between 2000 to 2001 the number of dolphin sightings increase the most.
Question 2.
What number of students could locate materials in 20 minutes?
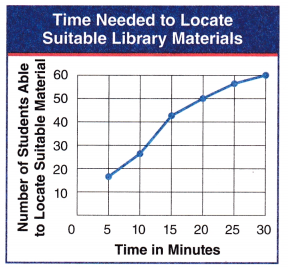
Answer:
From the above line graph, we can say that 50 students were able to locate suitable material.
Question 3.
Looking at the line graph below, what two days would you try to avoid going to the Registration office?
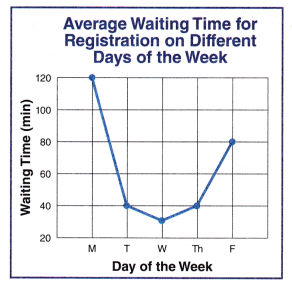
Answer:
By Looking at the line graph shown above we have to avoid Monday and Friday to avoid going to the Registration office.
Question 4.
Between which two days did the number of correct facts increase the most?
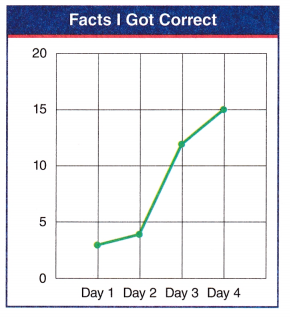
Answer:
By Looking at the line graph shown above, we can say that on Day 3 and 4 the number of correct facts increases the most.
Question 5.
What are the two most popular days for consuming potatoes, according to the line graph?
How many kilos of potatoes are consumed on those two days?
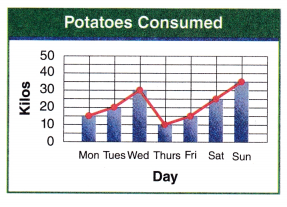
Answer:
According to the line graph, Wednesday and Sunday are the popular days for consuming potatoes.
30 + 35 = 65
65 kilos of potatoes are consumed on those two days.
Question 6.
From the line graph below, describe the levels of ozone between January and March.
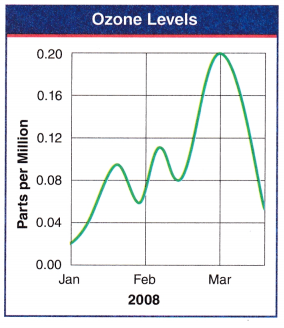
Answer:
The levels of ozone between January and March is 0.08